
Backtesting options strategies is the process of applying defined trading rules to historical options market data to measure a strategy's past performance and risk before deploying real capital. Unlike stock backtesting, options strategy testing requires full historical option chains, implied volatility surfaces, and accurate Greeks data to produce credible results. Key metrics like the Sharpe ratio and max drawdown tell you whether a strategy is worth trading or just looks good on paper. Morningoptions uses a five-AI pipeline to vet and score trade ideas daily, which means understanding what a rigorous backtest looks like helps you get far more out of those insights.
What is backtesting options strategies and why does it matter?
Backtesting options strategies is defined as the systematic evaluation of a set of trading rules against historical options market data to estimate how those rules would have performed. The goal is not to predict the future. The goal is to measure historical edge, identify risk exposure, and stress-test assumptions before a single dollar goes live.
Options strategy testing differs fundamentally from equity backtesting. Stock backtesting needs price data. Options backtesting requires historical strike prices, expirations, bid-ask spreads, and implied volatility surfaces because options returns depend on Greeks and path dependence. A strategy that looks profitable using only stock price data will almost certainly fail when you add realistic options market conditions.

The Sharpe ratio and max drawdown are the two metrics that matter most in early evaluation. A Sharpe ratio between 1.0 and 3.0 signals a credible result. Max drawdown tells you the worst equity decline the strategy produced, which predicts whether you will actually stick with it when things go wrong. A strategy with a 15% annualized drawdown will typically be abandoned by traders even if it is profitable over time.
What data and inputs are essential for accurate options backtesting?
Accurate options backtesting lives or dies on data quality. Options returns depend on Greeks like Theta and Vega, and on path dependency, meaning the sequence of price moves matters, not just the start and end points. Stock price data alone cannot capture this.
The minimum data requirements for credible options backtesting include:
- Full historical option chains: Strike prices, expiration dates, and contract-level pricing for every day in the test period.
- Implied volatility surfaces: IV data across strikes and expirations to model how options were actually priced at each point in time.
- Bid-ask spreads: Spreads vary dramatically. A liquid SPY option may carry a $0.01 spread while an illiquid mid-cap option can carry $0.50 or more. That difference directly eats into profitability.
- Greeks data: Theta decay curves and Vega exposure must be modeled accurately to reflect real position behavior.
- Point-in-time data: Your backtest must only use information that was available at the exact moment a trade decision would have been made.
Look-ahead bias is the most common data error. Most beginners use data unavailable at the trade decision time, such as end-of-day prices for intraday signals. This inflates performance and invalidates the entire test. Point-in-time databases that replicate the exact information available at each trade timestamp are the only reliable solution.
Options backtesting is fundamentally a data engineering challenge, not just a simulation exercise. Reconstructing historical option chains accurately, including dealer exposure and causal signals, is what separates a credible backtest from a fantasy.
Pro Tip: Use realistic fill price assumptions. Modeling fills at 30%–70% of the bid-ask spread rather than at the mid-price produces results that reflect what you would actually get executed at in live markets.
How do you define and mechanically implement options backtesting rules?
Clear, mechanical rules are the foundation of any credible backtest. A rule like "sell a 16-delta put at 45 days to expiration" is testable. A rule like "sell a put when the market looks oversold" is not. Discretionary bias inflates backtest metrics and produces results that cannot be reproduced in live trading.
Every options strategy definition needs five components:
- Entry trigger: The specific condition that initiates a trade. Example: IV rank above 30, sell a 30-delta credit spread.
- Strike and expiration selection: Exact delta targets or strike offsets, and a defined DTE (days to expiration) window.
- Position sizing: A fixed number of contracts or a percentage of portfolio risk per trade.
- Exit rules: Profit targets (e.g., close at 50% of max credit), stop-loss thresholds (e.g., close at 200% of credit received), or time-based exits (e.g., close at 21 DTE).
- Management rules: Adjustments for rolling, adding legs, or reducing size under defined conditions.
Multi-leg strategies like iron condors and calendar spreads add complexity. Each leg needs its own entry and exit logic, and the combined position must be tracked as a single unit. Skipping this step causes position accounting errors that corrupt your results.
Common backtestable strategies include the wheel strategy, cash-secured puts, covered calls, vertical credit spreads, and iron condors. Each has well-defined mechanical rules that translate cleanly into a backtest framework.
Pro Tip: Validate your rule logic manually on five to ten historical trades before running a full backtest. This catches leaky assumptions, like rules that accidentally reference future data, before they corrupt hundreds of trades.
What are the common mistakes and pitfalls in options backtesting?
Overfitting is the single biggest threat to a useful backtest. Overfitting happens when you tune parameters to match historical data so closely that the strategy has no predictive power going forward. A structured validation framework limits adjustable parameters to one per 50 trades and requires out-of-sample testing to confirm that results hold on data the model never saw.
Backtests showing returns exceeding 500% annually are almost certainly incorrect or overfitted. A credible target Sharpe ratio falls between 1.0 and 3.0.
The most common pitfalls in options backtesting are:
- Look-ahead bias: Using data that was not available at the time of the trade decision. This is the most common error and the hardest to detect.
- Survivorship bias: Testing only on stocks or ETFs that still exist today. Companies that went bankrupt or were delisted are excluded, which inflates results. Reconstruct the historical universe as it existed at each point in time.
- Mid-price fill fantasy: Slippage and liquidity costs often destroy theoretical profits. Mid-price fills are unrealistic, especially for multi-leg strategies. Model fills at bid or ask with a liquidity discount.
- Ignoring transaction costs: Commissions, exchange fees, and assignment costs add up across hundreds of trades. Exclude them and your net profitability is fiction.
- Flattening portfolio returns: A credible backtest aggregates portfolio-level risk and daily PnL rather than averaging per-symbol returns. Averaging masks true risk exposure across correlated positions.
Pro Tip: Stress-test your backtest by running it through the 2008 financial crisis, the 2020 COVID crash, and the 2022 rate-hike bear market. If the strategy collapses in all three, the edge is regime-dependent, not durable.
How do you interpret backtesting results to improve your trading?
Backtesting results are only useful if you read them correctly. Four metrics form the core evaluation framework: Sharpe ratio, max drawdown, win rate, and average profit and loss per trade.
| Metric | What it measures | Red flag threshold |
|---|---|---|
| Sharpe ratio | Risk-adjusted return | Below 1.0 or above 3.0 |
| Max drawdown | Worst peak-to-trough equity decline | Above 25% for most traders |
| Win rate | Percentage of profitable trades | Misleading without avg P&L |
| Average P&L | Mean profit or loss per trade | Negative after costs |
Win rate is the most misread metric. A strategy with a 70% win rate can still lose money if the average loss is three times the average gain. Always read win rate alongside average P&L and risk-reward ratio.
Robust backtests verify performance across varying market regimes, including VIX spikes, bear markets, and low-volatility grind periods. A strategy that only works in one regime is not an edge. It is a correlation.
Max drawdown deserves special attention. A strategy with a 15% annualized drawdown will typically be abandoned by traders even when it is profitable. If the drawdown exceeds what you can psychologically and financially tolerate, the strategy is not viable for you regardless of its theoretical returns.
Pro Tip: Treat backtesting as ongoing research, not a one-time validation. Re-run your tests quarterly as market conditions shift and new data becomes available.
What tools and workflows help traders backtest options strategies effectively?
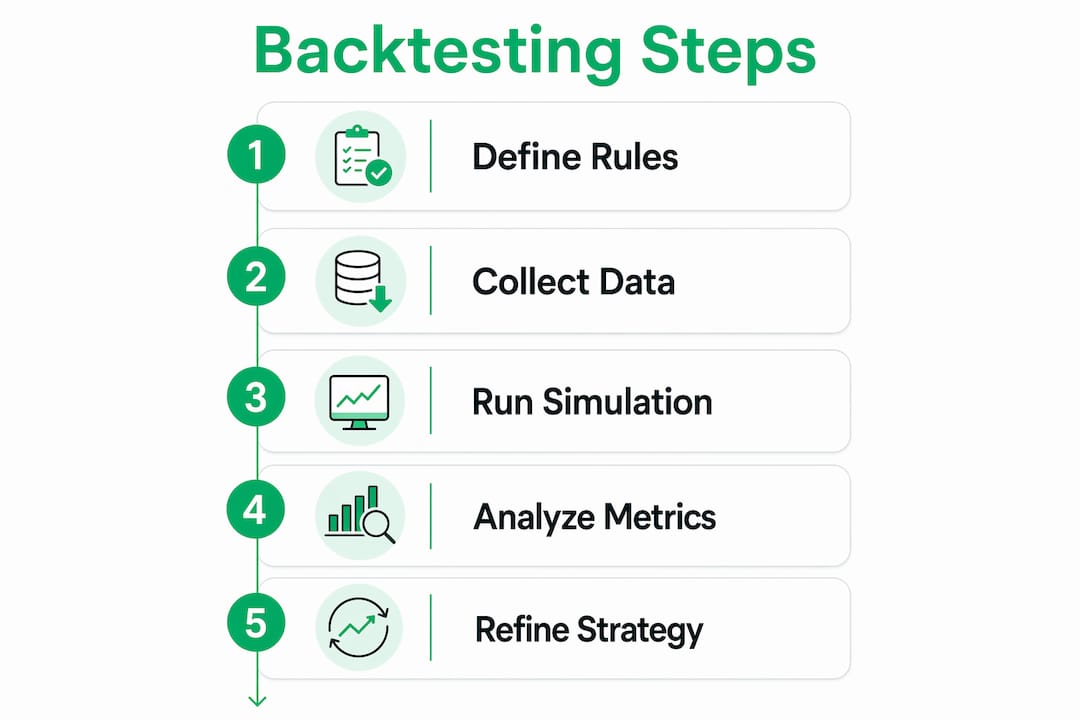
A credible backtesting workflow follows six stages. Skipping any stage is the most common source of misleading results.
- Hypothesis formulation: Define the market inefficiency or edge you believe exists. Example: selling premium in high-IV environments generates consistent credit.
- Mechanical rule definition: Translate the hypothesis into exact, unambiguous trading rules with no discretionary elements.
- Data acquisition: Source historical option chains with full strike and expiration coverage, IV surfaces, and bid-ask data. Python libraries like pandas and NumPy handle data manipulation well. Spreadsheets work for simple single-leg strategies but break down quickly for multi-leg positions.
- Test execution: Run the strategy rules against historical data, modeling fills realistically within the bid-ask spread.
- Result validation: Check for overfitting, look-ahead bias, and survivorship bias. Run out-of-sample tests on data the model never touched.
- Stress testing and refinement: Test across multiple market regimes. Adjust position sizing or exit rules based on what the data reveals, not what you hoped to see.
Automation matters for complex strategies. Iron condors, calendars, and diagonal spreads involve multiple legs with interdependent exit logic. Manual tracking across hundreds of trades introduces errors. Python scripts or purpose-built backtesting platforms handle this more reliably than spreadsheets.
Start with the simplest version of your strategy. A single-leg cash-secured put is easier to validate than a four-leg iron condor. Once the simple version shows a credible edge, add complexity one element at a time.
Key Takeaways
Backtesting options strategies produces credible results only when you combine point-in-time data, mechanical rules, realistic fill modeling, and out-of-sample validation across multiple market regimes.
| Point | Details |
|---|---|
| Data quality is non-negotiable | Full option chains, IV surfaces, and bid-ask spreads are required for accurate results. |
| Mechanical rules prevent bias | Vague or discretionary rules inflate metrics and cannot be reproduced in live trading. |
| Overfitting destroys edge | Limit adjustable parameters to one per 50 trades and always test on out-of-sample data. |
| Max drawdown predicts survivability | A drawdown beyond your tolerance will cause you to abandon a profitable strategy at the worst time. |
| Regime testing reveals true edge | A strategy that only works in bull markets is a correlation, not a durable trading edge. |
Why most traders backtest wrong and what I've learned from it
The biggest mistake I see traders make is confusing a backtest that looks good with a backtest that is good. Those are two very different things. Early on, I ran backtests that showed spectacular returns, only to find out later that I had accidentally used closing prices for entries that would have required intraday execution. The look-ahead bias was invisible until I stress-tested the logic manually.
The discipline of writing mechanical rules is harder than it sounds. You will be tempted to add qualifiers like "when the market feels stable" or "unless there is a major event." Those qualifiers cannot be tested. They are discretionary judgment calls dressed up as rules. Every time you add one, you are introducing bias that makes your backtest look better than your live trading will ever be.
Realistic cost modeling is where most theoretical edges disappear. When I started modeling fills at the ask rather than the mid on short premium trades, my average P&L per trade dropped noticeably. That was uncomfortable. It was also the truth. A backtest that flatters you is worse than no backtest at all, because it gives you false confidence going into live markets.
My honest advice: think like a quant even if you never write a line of code. Define your rules precisely. Question every assumption. And treat every backtest result as a hypothesis to be disproved, not a result to be celebrated.
— Customer
How Morningoptions supports your options strategy research
Backtesting tells you what worked historically. Morningoptions tells you what is worth looking at today.
The Morningoptions AI scanner runs a five-AI pipeline every morning to vet, score, and deliver high-quality trade ideas before the market opens. Each idea comes with detailed insight covering strategy rationale, risk parameters, and context that complements your own backtesting work. Whether you are validating a credit spread approach or researching wheel strategy setups, Morningoptions gives you a daily starting point grounded in data rather than noise. It also covers options strategies education from basic to advanced, so you can build the knowledge base that makes your backtests more meaningful.
FAQ
What is options backtesting in simple terms?
Options backtesting is the process of testing a set of trading rules against historical options market data to measure how the strategy would have performed. It lets you evaluate risk and profitability before committing real capital.
Why is options backtesting harder than stock backtesting?
Options require full historical chains including strike prices, expirations, implied volatility surfaces, and bid-ask spreads. Stock backtesting only needs price data, making options backtesting significantly more data-intensive and technically demanding.
What is a good Sharpe ratio for a backtested options strategy?
A Sharpe ratio between 1.0 and 3.0 indicates a credible result. Results above 3.0 are likely overfitted. Results below 1.0 suggest the strategy does not generate enough return for the risk it takes.
How do you avoid overfitting in options backtesting?
Limit adjustable parameters to one per 50 trades and always validate results on out-of-sample data that the model never saw during development. Stress-testing across multiple market regimes also exposes strategies that only work under specific conditions.
What is look-ahead bias and why does it matter?
Look-ahead bias occurs when a backtest uses data that was not available at the time the trade decision would have been made. It inflates performance and makes a strategy appear profitable when it is not. Point-in-time databases eliminate this error.