
A high probability trade is defined as a setup where multiple independent confirming factors align to create a statistical edge, supported by a predefined risk/reward framework and a realistic expectancy of profitability over many trades. The industry standard for these setups targets a 60–75% win rate with a minimum 2:1 reward-to-risk ratio. That combination is what separates disciplined trading from gambling. This guide breaks down the core components, common traps, and a practical framework for identifying high probability setups in options trading.
What makes a trade high probability?
A high probability trade is built on confluence, which is the alignment of multiple independent confirming factors pointing in the same direction. The word "independent" is critical here. True confluence requires factors from separate domains: a price level, a time-based liquidity window, and a volume confirmation. Stacking three moving averages does not count. They all measure the same thing.
The statistical sweet spot sits at 3–5 independent factors. Adding more does not improve your edge. Past that threshold, you start fitting your setup to historical noise rather than identifying a repeatable pattern.

Risk management is the second pillar. A setup with no defined stop loss is not a high probability trade. It is a hope. Professional traders risk 1–2% of capital per trade and require a minimum 2:1 reward-to-risk ratio before entering. That math means you can be wrong 40% of the time and still grow your account.
The third pillar is market context. A long setup during a broad market sell-off carries lower probability than the same setup in a rising market. Trend alignment with the higher timeframe is not optional. It is a filter.
Key factors that define a high probability setup:
- Confluence: 3–5 independent confirming factors from separate domains
- Risk/reward: Minimum 2:1 ratio with a defined stop loss before entry
- Trend alignment: Setup direction matches the higher timeframe trend
- Volume confirmation: A volume spike validates the price move, not just the level
- Market context: Broad conditions support, not contradict, the trade direction
Pro Tip: Before entering any trade, write down your three independent confirming factors. If two of them come from the same indicator family (like RSI and Stochastics), you have pseudo-confluence, not a real edge.
Common mistakes traders make when spotting high probability setups
The most expensive mistake in high probability trading is pseudo-confluence. Traders layer five indicators on a chart, see them all agree, and feel confident. The problem is that RSI, MACD, and Stochastics are all derived from price momentum. They are not independent. Combining dependent indicators creates false confidence, not a real statistical edge.
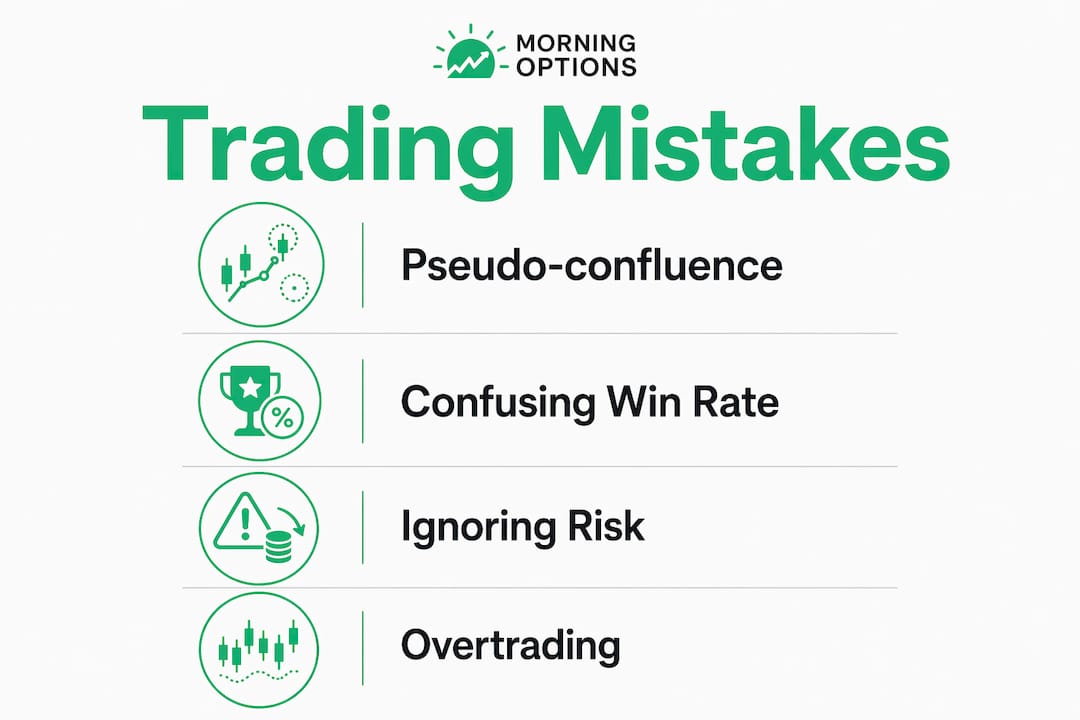
The second mistake is confusing a high win rate with a good trade. A 70% win rate sounds excellent until you realize the losses are three times the size of the wins. That math destroys accounts. High probability means sound trade math, not just winning more often. Expectancy, which is the average profit per trade after accounting for wins and losses, is the real metric.
Context dependence trips up traders who find a setup that works in one market condition and apply it everywhere. A momentum breakout is a high probability setup in trending markets but a trap in range-bound conditions. The setup did not change. The environment did.
Common pitfalls to avoid:
- Pseudo-confluence: Stacking correlated indicators and calling it confirmation
- Win rate fixation: Ignoring reward-to-risk and expectancy in favor of raw win percentage
- Context blindness: Applying a trending strategy in a choppy, range-bound market
- Overfitting: Requiring so many confirming factors that no trade ever qualifies
- Noise trading: Taking setups with only one or two weak confirming factors
Pro Tip: After 50 trades, tag each one by its confluence combination in your journal. Calculate win rate and expectancy per combination. You will quickly see which setups actually have an edge and which ones just felt good.
How to identify and execute high probability trades systematically
A repeatable process beats intuition every time. The five-step filtering framework is the most widely applied structure for enforcing discipline in trade selection. Each step acts as a gate. A trade that fails any step does not get taken.
The five-step filtering framework
- Confirm trend direction. Check the higher timeframe first. The trade must align with the dominant trend. Counter-trend trades require a much higher confluence score to justify entry.
- Validate the setup. Identify your 3–5 independent confirming factors. Price level, volume, time-based window, and trend structure are the most reliable domains. Confirm they are genuinely independent.
- Wait for an entry trigger. A setup is not an entry. A candlestick pattern, a breakout above resistance, or a volume surge at a key level is the trigger. Entering before the trigger fires is anticipation, not confirmation.
- Define your risk and stop loss. Place your stop before you enter. The stop location determines your position size. If the stop placement requires risking more than 2% of your account, the trade does not qualify.
- Set a clear target. Your target defines the reward side of the ratio. A minimum 2:1 reward-to-risk ratio is the professional standard. Without a target, you cannot calculate expectancy.
Position sizing and journaling
Position sizing is where most retail traders lose discipline. The rule is simple: risk 1–2% of your total account on any single trade. On a $10,000 account, that means a maximum loss of $100–$200 per trade. This keeps a losing streak from becoming a catastrophe.
Journaling is the tool that turns experience into data. Tagging confluence combinations in your trade journal lets you calculate which specific setups produce positive expectancy over 50–100 trades. That analysis tells you which setups to take more of and which ones to cut.
| Step | Action | Purpose |
|---|---|---|
| Trend direction | Check higher timeframe | Filters counter-trend noise |
| Setup validation | Confirm 3–5 independent factors | Builds true confluence |
| Entry trigger | Wait for confirmation signal | Avoids premature entry |
| Risk definition | Set stop loss before entry | Controls maximum loss |
| Target setting | Calculate 2:1 reward-to-risk | Ensures positive expectancy |
Patience is the hardest part of this process. A 70% win rate setup still loses 30% of the time. Accepting that reality, and sticking to the framework anyway, is what separates traders who build accounts from those who blow them up.
Examples of high probability options strategies and their risk profiles
Options trading offers several strategies that naturally produce high win rates. Selling iron condors and selling out-of-the-money puts are the most common examples. These strategies collect premium when the underlying asset stays within a defined range or above a certain level. Win rates of 70% or higher are achievable with these approaches.
The catch is negative skew. These strategies produce small, frequent profits and occasional large losses. A single bad trade can wipe out months of gains if position sizing is not disciplined. That is the defining risk of high probability options selling strategies.
| Strategy | Typical win rate | Risk profile | Key requirement |
|---|---|---|---|
| Short iron condor | 70%+ | Negative skew, large tail risk | Strict position sizing |
| Short OTM put | 70%+ | Negative skew, assignment risk | Defined stop or hedge |
| Long call/put spread | 40–55% | Positive skew, limited loss | Higher reward-to-risk target |
| Cash-secured put | 65–75% | Moderate negative skew | Willingness to own shares |
High probability does not mean low risk. It means the math favors you over many trades, provided you manage the losses when they come. Disciplined position sizing and strict risk controls are what make these strategies sustainable, not the win rate alone.
Key Takeaways
High probability trading succeeds because it combines independent confluence, strict risk/reward discipline, and consistent execution across many trades, not because it eliminates losing trades.
| Point | Details |
|---|---|
| Confluence requires independence | Use 3–5 factors from separate domains; correlated indicators create false confidence. |
| Win rate alone is not enough | Expectancy and reward-to-risk ratio determine long-term profitability, not win percentage. |
| Risk 1–2% per trade | Limiting capital exposure per trade protects accounts through inevitable losing streaks. |
| Context changes probability | The same setup has different odds in trending versus range-bound markets. |
| Journal your setups | Tracking confluence combinations over 50–100 trades reveals which setups actually have an edge. |
The uncomfortable truth about high probability trading
Most traders come to high probability strategies looking for certainty. They want a setup that wins almost every time. That is the wrong goal, and chasing it leads to the worst mistake in trading: overloading indicators until every chart looks like a buy signal.
The traders I have seen build real consistency share one habit. They keep a detailed journal, not to track profits, but to track which specific confluence combinations produce positive expectancy. After 100 trades, the data tells you exactly which setups to take and which ones to skip. No gut feel required.
The other thing that separates consistent traders is their relationship with losses. A 70% win rate setup loses three out of every ten trades. If you cannot accept that mathematically and emotionally, the strategy will not work for you. The traders who adapt their setups to changing market conditions, rather than forcing the same approach in every environment, are the ones who last.
High probability trading is a numbers game played with discipline. The edge is real, but only if you protect it with position sizing, context awareness, and honest journaling. Skip any one of those, and the win rate becomes meaningless.
— Customer
How Morningoptions fits into your high probability trading process
Every morning before the open, you need to know which setups have the strongest confluence, not which tickers are trending on social media. Morningoptions delivers AI-powered trade ideas ranked by a five-stage AI pipeline that vets, scores, and explains each setup before the market opens.
The free daily briefing gives you specific contract ideas with entry levels every morning. The Pro tier at $89/mo adds a lunchtime scanner and an on-demand AI chat scanner for researching any ticker in real time. Both tools are built around the same principle this article covers: independent confluence, defined risk, and a clear edge before you commit capital. Active retail options traders who want a fast, clear read on the day's setups before the open use Morningoptions to cut through the noise and focus on what actually qualifies.
FAQ
What is a high probability trade in simple terms?
A high probability trade is a setup where multiple independent factors align to give you a statistical edge, supported by a defined stop loss and a minimum 2:1 reward-to-risk ratio.
How many confirming factors does a high probability setup need?
The sweet spot is 3–5 independent confirming factors. Adding more than five typically leads to overfitting rather than a stronger edge.
Does a high win rate mean a trade is high probability?
Not by itself. A high win rate only qualifies as high probability when paired with a favorable reward-to-risk ratio and positive expectancy over many trades.
Why do high probability options strategies still lose money sometimes?
Strategies like selling iron condors have negative skew, meaning small frequent wins and occasional large losses. Without strict position sizing, a single large loss can erase months of gains.
How do I know if my confluence factors are truly independent?
Ask whether each factor measures a different aspect of the market. Price level, volume, time-based liquidity, and trend structure are independent. RSI, MACD, and Stochastics all measure price momentum and are not independent of each other.