
Sector analysis trading is the practice of allocating capital across market sectors based on their relative strength and position in the economic cycle. The S&P 500 contains 11 distinct sectors that do not move together, which creates persistent gaps in performance that skilled traders exploit. Retail traders using sector rotation to follow institutional money flows can capture 3–7% annualized alpha over a simple buy-and-hold approach. That edge comes from reading where institutional capital is moving before the price charts make it obvious. Morningoptions applies this same logic daily, surfacing sector-driven options ideas before the market opens.
What is sector analysis trading and why does it matter?
Sector analysis trading, also called sector rotation, is the method of shifting capital toward sectors that are positioned to outperform given the current phase of the economic cycle. The core insight is simple: different sectors lead at different points in the business cycle, and that sequence is repeatable. Traders who map that sequence correctly gain a structural edge over those who chase individual stocks without macro context.
The performance gap between sectors makes this worth your attention. The spread between the top and bottom performing sectors in the S&P 500 can reach 20–40 percentage points over any six-month window. That spread represents real money left on the table by traders who ignore sector allocation entirely.
How does the business cycle drive sector rotation?
The business cycle moves through four phases, and each phase produces a different set of sector leaders. Understanding this sequence is the foundation of every serious sector rotation strategy.
Early cycle follows a recession. Credit loosens, consumer confidence rises, and spending picks up. Consumer Discretionary and Financials lead this phase because cheap borrowing costs fuel both consumer spending and bank lending margins.
Mid-cycle is the expansion phase. Corporate earnings grow, capital spending increases, and Technology takes the lead. This is the longest phase of most cycles and the one where growth-oriented sectors deliver the strongest returns.

Late cycle brings tightening credit, rising inflation, and slowing growth. Energy and Materials outperform because commodity prices rise with demand even as the broader economy cools. Industrials also tend to hold up well here.
Recession shifts capital into defense. Utilities and Consumer Staples lead because their revenues are stable regardless of economic conditions. Investors pay a premium for predictability when growth disappears.
| Business cycle phase | Leading sectors | Lagging sectors |
|---|---|---|
| Early cycle | Consumer Discretionary, Financials | Utilities, Energy |
| Mid-cycle | Technology, Communication Services | Staples, Utilities |
| Late cycle | Energy, Materials, Industrials | Technology, Discretionary |
| Recession | Utilities, Consumer Staples | Financials, Industrials |
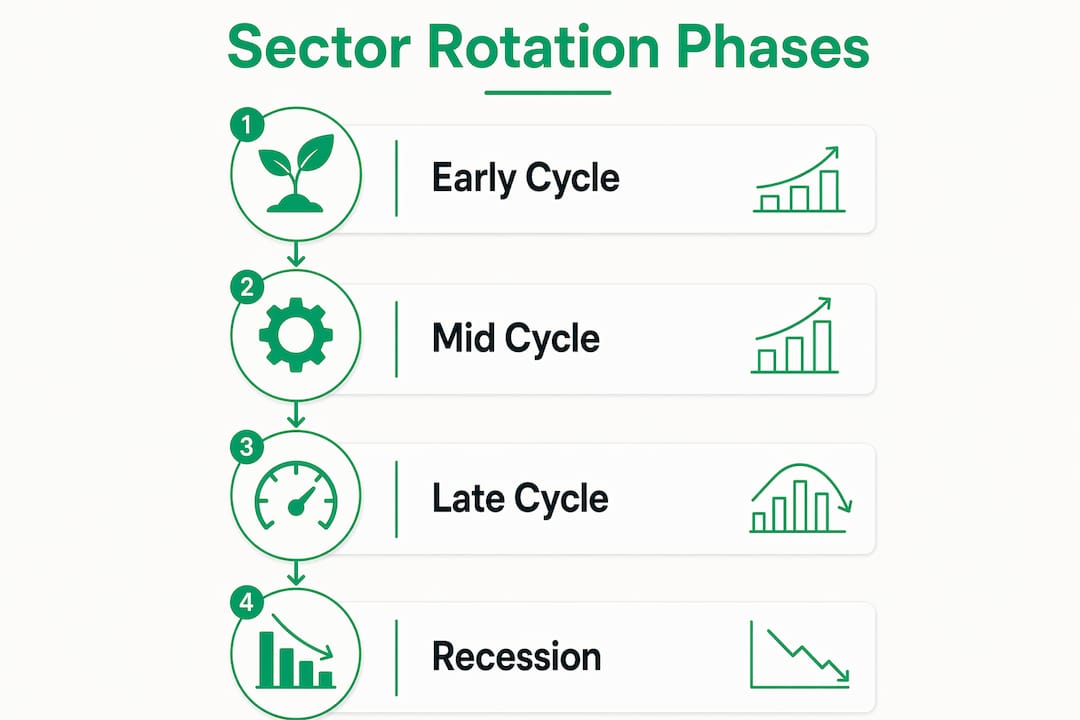
Sectors rotate in this repeatable sequence tied to economic trends, which means the rotation is not random. It is predictable enough to trade systematically.
Pro Tip: Watch the yield curve alongside sector signals. When the 2-year Treasury yield crosses above the 10-year, late-cycle and defensive sector tilts typically become more reliable.
How does relative strength analysis inform sector trading decisions?
Relative strength (RS) is the ratio of a sector's price performance against a benchmark, typically SPY or the S&P 500 index. A rising RS line means the sector is outperforming the market. A falling RS line means it is lagging, regardless of whether its absolute price is up or down.
Ranking sectors by relative strength rather than absolute price gain prevents misleading interpretations. A sector can gain 8% in a month and still be a laggard if the broader market gained 12%. Absolute returns alone tell you nothing about whether capital is flowing into or out of a sector relative to alternatives.
Traders use three main RS tools:
- RS line: The sector price divided by the benchmark price, plotted over time. A rising slope confirms leadership.
- Moving average slope: A 10-week or 13-week moving average applied to the RS line smooths out noise and confirms trend direction.
- Momentum indicators: Rate-of-change calculations on the RS line identify sectors accelerating into leadership versus those losing momentum.
Combining sector RS with individual stock RS improves both win rate and trade timing. You want the sector leading the market and the stock leading the sector. That double-filter removes a large portion of false signals.
Pro Tip: Add volume breadth confirmation. When a sector's RS line rises and advancing volume outpaces declining volume across that sector's stocks, the signal is far more reliable than RS alone.
What are effective sector rotation strategies and portfolio construction methods?
The core-and-tilt model is the most practical structure for retail traders applying sector analysis. A 70% broad-market index core paired with a 30% dynamic sector tilt balances stability with alpha generation. The core holds through all market conditions. The tilt rotates based on RS rankings and fund flow data.
Here is a step-by-step approach to implementing sector rotation:
- Rank all 11 S&P 500 sectors by RS against SPY using a 13-week lookback period. Update this ranking monthly.
- Identify the top 2–3 sectors by RS rank and confirm with ETF fund flow data showing net inflows.
- Check business cycle alignment. If your RS leaders match the expected leaders for the current cycle phase, the signal is stronger.
- Allocate the 30% tilt equally across the top 2–3 confirmed sectors using sector ETFs such as XLK, XLE, or XLF.
- Avoid the bottom-ranked sectors entirely. Removing lagging sectors historically contributes more to risk-adjusted returns than overweighting the top sectors.
- Rebalance monthly or quarterly. Monthly to quarterly rebalancing avoids excessive trading costs and slippage while staying aligned with medium-term trends.
- Rotate only when sector ranks shift with confirmation. One week of RS reversal is noise. Two to three weeks of confirmed rank change warrants a rebalance.
Pro Tip: Set a minimum rank-change threshold before rotating. Require a sector to move at least two positions in the RS ranking before you act. This single rule cuts unnecessary trades by roughly half.
What data sources and tools can traders use for sector analysis in 2026?
Good sector analysis requires three layers of data: macro signals, institutional flow data, and technical confirmation.
- ETF fund flows: Net inflows and outflows from sector ETFs are the most accessible leading indicator. Institutional money flows visible through ETF fund flow data precede price moves by days to weeks. When large capital enters XLK or XLE before a price breakout, the flow data shows it first.
- 13F filings: Institutional investors managing over $100 million must file 13F reports with the SEC each quarter. These filings reveal which sectors the largest funds are building or cutting positions in. They lag by up to 45 days but confirm the direction of major capital shifts.
- Relative strength charts: Most charting platforms display RS lines for sector ETFs against SPY. Plotting a 13-week RS line with a 10-week moving average gives a clean, actionable signal.
- Breadth indicators: The percentage of stocks in a sector trading above their 50-day moving average measures the internal health of that sector. Sector-wide volume breadth and moving average slope provide more reliable direction signals than price alone.
- AI-powered scanners: Morningoptions runs a five-AI pipeline each morning that vets, scores, and ranks options trade ideas with sector context built in. The Pro tier ($89/mo) includes a lunchtime scanner and an on-demand AI chat tool for researching specific tickers as sector conditions shift during the day.
Balancing these signals matters. No single data source is sufficient. Traders who act on fund flows alone without RS confirmation tend to enter too early. Those who wait for RS confirmation without checking fund flows tend to enter too late.
What are common pitfalls in sector analysis trading?
The most common mistake is ranking sectors by absolute price performance instead of relative strength. A sector up 15% in a bull market may still be a laggard. Ranking by absolute price movement without benchmark comparison leads to false signals and poor capital allocation.
The second major pitfall is over-trading. Sector rotation is not suited for day trading because institutional capital shifts take weeks to unfold. Traders who react to daily volatility instead of medium-term trends pay excessive transaction costs and miss the actual rotation.
The third pitfall is ignoring macro regime shifts. A sector rotation model calibrated for a risk-on environment will give wrong signals during a credit crisis or a Federal Reserve tightening cycle. Traders need a macro filter that distinguishes between risk-on and defensive regimes before applying RS rankings.
Successful sector rotation traders treat the market as eleven distinct sectors for risk management and deliberately tilt allocations based on disciplined, evidence-based frameworks rather than chasing individual stock picks. The discipline of the framework is what separates consistent performers from those who rotate reactively and underperform the index they were trying to beat.
Risk management sits at the center of sector rotation philosophy. Avoiding the wrong sectors is as important as picking the right ones.
Key Takeaways
Sector analysis trading outperforms buy-and-hold by combining business cycle awareness, relative strength ranking, and institutional flow confirmation into a disciplined, rules-based allocation system.
| Point | Details |
|---|---|
| Define sector leadership by RS | Rank sectors by relative strength against SPY, not by absolute price gains. |
| Follow the business cycle | Match sector tilts to the current cycle phase: early, mid, late, or recession. |
| Use the core-and-tilt structure | Hold 70% in a broad index core and rotate 30% across the top 2–3 RS-ranked sectors. |
| Rebalance on a medium-term schedule | Monthly or quarterly rebalancing captures sector trends without excessive trading costs. |
| Avoid lagging sectors actively | Removing bottom-ranked sectors improves risk-adjusted returns more than overweighting leaders. |
Why sector rotation changed how I read the market
I spent years picking individual stocks and wondering why my winners never seemed to compound the way I expected. The problem was not stock selection. The problem was that I was fishing in the wrong pond. When Technology was in a late-cycle fade and I was buying growth names, no amount of stock-picking skill was going to overcome that headwind.
Switching to a sector-first framework forced a mindset shift. You stop asking "Is this a good company?" and start asking "Is capital flowing into this sector right now?" That question is answerable with data. The RS line, fund flows, and business cycle phase give you a structured answer every week.
The core-and-tilt approach also removed most of my emotional trading. When the 30% tilt is rules-based and rebalances on a monthly schedule, there is no decision to make in the middle of a volatile week. The framework makes the decision. That discipline alone improved my results more than any individual trade idea ever did.
Traders transitioning from stock picking to sector focus often underestimate how much patience the approach requires. Sector rotations take weeks to confirm. The traders who succeed are the ones who wait for confirmation rather than anticipating the next rotation too early.
— Customer
How Morningoptions fits into your sector trading workflow
Sector analysis tells you where to look. Morningoptions tells you what to do when you get there.

Every morning before the open, Morningoptions delivers ranked options trade ideas built on a five-AI pipeline that vets each setup for sector momentum, entry level, and contract specifics. You get a clear read on which sectors are showing strength and which specific options plays align with that strength. The free daily briefing covers the top setups. The Pro tier at $89/mo adds a lunchtime scanner and an AI chat tool so you can research any ticker as sector conditions shift through the session. For traders who want to apply sector-driven options strategies with precision, Morningoptions removes the guesswork from execution.
FAQ
What is sector analysis trading in simple terms?
Sector analysis trading is the practice of shifting capital toward market sectors that show the strongest relative performance given the current economic cycle phase. It is also called sector rotation.
How many sectors does the S&P 500 have?
The S&P 500 contains 11 sectors, including Technology, Financials, Energy, Utilities, and Consumer Discretionary. Each sector moves independently, creating performance gaps that sector rotation strategies exploit.
How often should I rebalance a sector rotation portfolio?
Monthly to quarterly rebalancing is the standard recommendation. More frequent rebalancing increases transaction costs and slippage without meaningfully improving returns.
What is relative strength in sector trading?
Relative strength is the ratio of a sector's price performance against a benchmark like SPY. A rising RS line confirms the sector is outperforming the market, regardless of its absolute price direction.
Can sector rotation work for options traders?
Sector rotation works well as a directional filter for options trades. Identifying the leading sector first narrows your focus to the stocks most likely to trend, which improves the probability of directional options plays.