
Options volume is defined as the total number of contracts traded in a session and serves as a leading indicator that frequently signals imminent moves in the underlying stock before price changes appear on a chart. Understanding why options volume signals moves requires more than counting contracts. It demands reading the Volume-to-Open-Interest (V/OI) ratio, identifying sweep orders, and recognizing institutional clustering patterns. Options markets move ahead of stocks because leverage attracts high-conviction traders whose urgent positioning shows up in volume first. Morningoptions scans this flow every morning so you can see the signals before the open.
Why options volume signals moves before price changes
Options volume signals moves because it captures the behavior of participants who are willing to pay a premium for directional exposure right now. When a trader buys 5,000 call contracts at the ask price across multiple exchanges in a single burst, that is not routine activity. That is a time-sensitive bet. The asymmetric payoffs of options attract institutional traders expressing strong, urgent views, and their footprints appear in volume data before the underlying stock reacts.
The key distinction is between volume that reflects new conviction and volume that reflects routine churn. A spike in call volume on a quiet Tuesday with no news is worth examining. The same spike the day before earnings is almost certainly noise. Volume becomes a genuine signal only when it points to fresh positioning by participants who have a reason to act with urgency.

Raw volume counts tell you what traded. They do not tell you why. That is why options volume analysis requires layering additional filters, including the V/OI ratio, trade aggression, and clustering across strikes, before you treat any print as a signal worth acting on.
What is the relationship between volume and open interest?
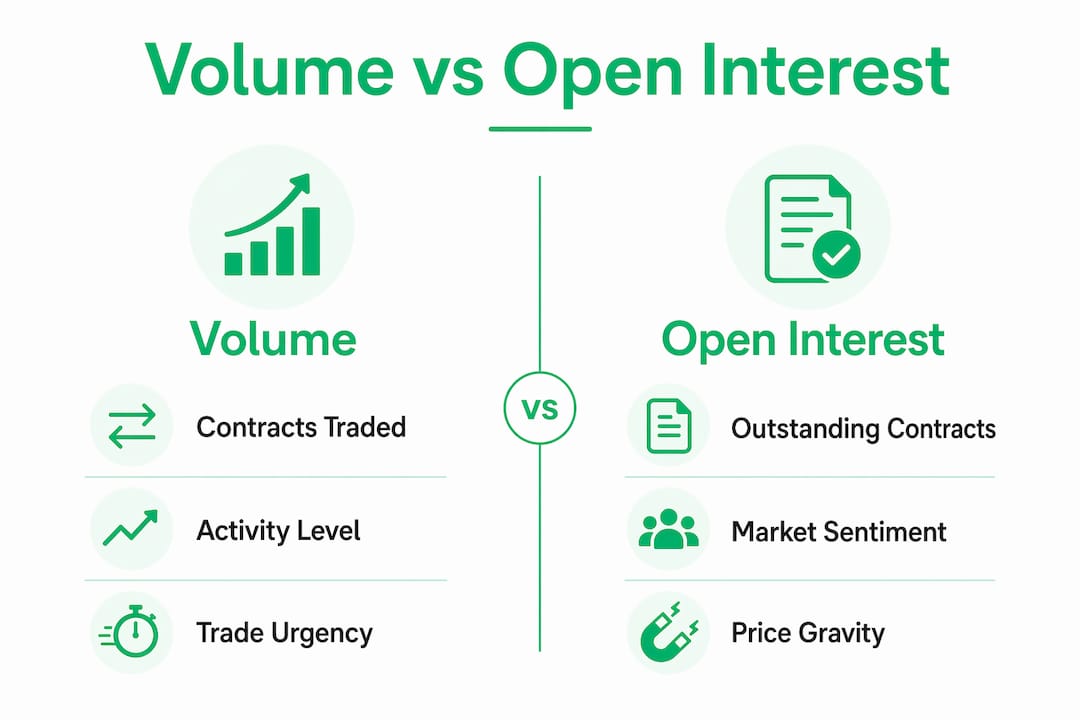
Open interest is the total number of outstanding, unsettled contracts at any given moment. Volume is how many contracts changed hands during a single session. These two numbers measure different things, and their relationship is where the real signal lives.
Rising volume paired with rising open interest means new money is entering the market. Traders are opening fresh positions, not closing old ones. That is the scenario that carries predictive weight. Rising volume paired with falling open interest means traders are exiting. The activity looks busy, but it signals unwinding, not new conviction.
The V/OI ratio formalizes this relationship. A V/OI ratio above 2.0 flags activity in the top 2.5% of all options trades. A ratio above 3.0 indicates aggressive, intentional new positioning. A ratio below 1.0 almost always reflects closing or routine trades with no predictive value.
| Metric | What it measures | What it signals |
|---|---|---|
| Volume | Contracts traded in a session | Activity level, not direction |
| Open interest | Outstanding unsettled contracts | Total market commitment |
| Rising V + Rising OI | New money entering | Fresh directional positioning |
| Rising V + Falling OI | Positions closing | Unwinding, not a new signal |
| V/OI above 2.0 | Highly unusual activity | Worth investigating further |
| V/OI above 3.0 | Aggressive new positioning | Strong, actionable signal |
Open interest also creates what traders call "price gravity." Market makers hedge around high-OI strikes, which pulls underlying prices toward those levels near expiration. That mechanic makes large open interest strikes worth watching as potential price targets in the final days before expiration.
How do sweep orders and trade aggression change the signal?
Trade aggression is the single most important filter for separating institutional intent from retail noise. An order executed at the ask price means the buyer was unwilling to wait. They paid up to get filled immediately. An order executed at the bid means the seller was in a hurry. The direction of aggression tells you who is acting with urgency.
Sweep orders take this further. A sweep hits multiple exchanges simultaneously at the ask price to fill a large order as fast as possible. The trader is not trying to get a good price. They are trying to get size before the opportunity closes. That urgency is itself informative. Sweeps signal that someone believes the window for this trade is short.
Block trades work differently. These are large, negotiated trades executed off-exchange between institutional counterparties. They reflect deliberate, planned positioning rather than urgency. Both sweep orders and block trades carry more weight than standard retail prints, but they require different interpretations.
- Sweep at the ask: Urgent, time-sensitive buying across exchanges. High conviction, short window.
- Block trade: Large negotiated position. Deliberate institutional intent, longer time horizon.
- Bid-side aggression: Seller in a hurry. Can signal hedging or distribution.
- Standard retail prints: Small size, mid-market fills. Low signal value on their own.
Pro Tip: Look for three or more sweeps on the same strike within a 30-minute window. A single sweep can be a hedge or a one-off. Repeated sweeps at the same strike within a short timeframe indicate coordinated, high-conviction positioning that is worth tracking.
Retail traders frequently misread volume because they skip this step. Actual institutional intent appears in aggressive sweeps and high V/OI ratios, not in raw contract counts. Treating every large print as smart money is one of the most common and costly mistakes in options trading.
Why raw volume is often misleading and how to filter it
Aggregate options volume can reflect noise or hedging rather than informed trading, especially around earnings announcements. High option-to-stock volume around earnings actually predicts lower announcement returns in aggregate, not higher ones. The crowd piling into options before a catalyst is often wrong, and the volume spike they create looks identical to genuine institutional flow on the surface.
Several specific scenarios produce misleading volume spikes. Expiration week generates mechanical volume as traders roll, close, or exercise positions. Earnings season drives speculative retail buying that inflates call volume without any informational edge behind it. Large hedges placed by funds to protect equity positions create volume that looks directional but is actually defensive.
Pro Tip: Before acting on a volume spike, check the put-call ratio and the volatility skew. A call volume spike with a flat or declining skew suggests retail speculation. A call spike with rising skew and a falling put-call ratio points toward genuine directional conviction.
The post-2019 retail surge changed the informational value of aggregate volume permanently. More contracts now trade on zero-day-to-expiration (0DTE) options and short-dated speculative plays, which adds noise to the aggregate data. Accurate signals now require combining volume with trade type, directional price action, and premium movement confirmation.
Volume without price context is particularly dangerous. Institutional absorption can cause large volume with no immediate price change, followed by a sharp move days later. If you see heavy call buying with the stock sitting flat, that is not a failed signal. It may be the setup phase before the move.
How to apply volume signals in your trading strategy
A systematic approach to options volume analysis stacks multiple filters before treating any print as a trade idea. No single data point is enough. The goal is confirmation across at least three dimensions before committing capital.
Systematic flow-based strategies that filter for high-conviction signals including sweeps and V/OI spikes achieve historical win rates of 55%–65% across multiple trades. That edge disappears when traders act on raw volume alone without the supporting filters.
A practical checklist for interpreting volume signals:
- Check the V/OI ratio. A ratio above 2.0 warrants attention. Above 3.0 is a strong signal. Below 1.0, move on.
- Confirm open interest direction. Rising OI alongside rising volume means new positioning. Falling OI means closing trades.
- Identify trade aggression. Was the order filled at the ask? Was it a sweep across exchanges? Aggression confirms urgency.
- Look for clustering. Repeated sweeps across adjacent strikes and expirations indicate coordinated institutional positioning, not a one-off print.
- Check the catalyst calendar. Earnings, FDA dates, and Fed meetings inflate volume mechanically. Discount volume spikes that align with known events unless aggression and V/OI are both elevated.
- Confirm with price action. Is the underlying stock holding a key level? Is premium expanding? Volume without price confirmation is incomplete.
Pro Tip: Never chase a single large print. One block trade or one sweep can be a hedge, a roll, or a mistake. Wait for a second confirmation before entering. The high-probability trade is the one with multiple signals pointing the same direction.
Risk management stays non-negotiable regardless of how clean the signal looks. Volume analysis improves your odds. It does not eliminate risk. Size positions accordingly and define your exit before you enter. Morningoptions runs this exact multi-filter process every morning, scoring each trade idea across volume, aggression, and catalyst context before it reaches your screen.
Key Takeaways
Options volume signals moves only when combined with open interest direction, trade aggression, and clustering patterns that confirm fresh institutional positioning rather than routine churn.
| Point | Details |
|---|---|
| V/OI ratio is the core filter | A ratio above 2.0 flags unusual activity; above 3.0 signals aggressive new positioning worth acting on. |
| Rising OI confirms new money | Volume paired with rising open interest means fresh directional bets, not position closing. |
| Sweep orders reveal urgency | Multi-exchange ask-side fills indicate time-sensitive institutional conviction, not routine retail activity. |
| Raw volume misleads around events | Earnings and expiration inflate volume mechanically; always filter for aggression and price confirmation. |
| Clustering beats single prints | Three or more sweeps at the same strike within a short window carry far more weight than one large trade. |
Volume signals are only as good as your filter stack
Most retail traders I have watched over the years make the same mistake. They see a big number in the volume column and assume someone smart is buying. That assumption costs money. The options market is full of hedges, rolls, and speculative retail prints that look identical to institutional flow on the surface.
The shift that happened after 2019 made this worse. The explosion of 0DTE trading and commission-free options apps flooded the tape with noise. Aggregate volume lost much of its informational edge. What replaced it is a more nuanced read that requires understanding trade signals at the microstructure level, not just the headline number.
The traders who use volume well treat it as one layer in a stack, not a standalone signal. They check the V/OI ratio first. They look at whether open interest is growing or shrinking. They ask whether the fills were aggressive. They look for clustering across related strikes. Only when all of those point the same direction do they consider acting.
The other thing I have learned is that patience matters more than speed here. The best volume setups do not require you to chase the print. They give you time to confirm and enter at a reasonable level. If you feel like you have to act in the next 30 seconds or miss the trade, that urgency is usually a sign you are reacting to noise, not reading a signal.
— Customer
Morningoptions scans volume signals so you do not have to
Every morning before the open, Morningoptions runs a five-stage AI pipeline across the options tape, scoring each unusual activity alert for V/OI ratio, trade aggression, sweep patterns, and catalyst context.

The free daily briefing delivers ranked trade ideas with specific contracts and entry levels, not vague commentary about what moved yesterday. The Pro tier at $89/mo adds a lunchtime scanner and an on-demand AI chat scanner so you can research any ticker's flow in real time. If you want to apply the volume analysis framework from this article without spending two hours screening the tape yourself, Morningoptions is built for exactly that workflow.
FAQ
What does options volume tell you about a stock's next move?
Options volume reveals the level of activity and urgency in a given contract. When combined with a rising V/OI ratio and aggressive sweep orders, high volume often precedes directional moves in the underlying stock.
What is a good Volume-to-Open-Interest ratio for a signal?
A V/OI ratio above 2.0 flags highly unusual activity, and a ratio above 3.0 indicates aggressive new positioning. Ratios below 1.0 typically reflect closing trades with no predictive value.
How do sweep orders differ from block trades in options?
Sweep orders execute immediately across multiple exchanges at the ask price, signaling urgent, time-sensitive buying. Block trades are large, negotiated off-exchange transactions that reflect deliberate institutional positioning with a longer time horizon.
Why is options volume sometimes misleading around earnings?
Aggregate volume around earnings often reflects speculative retail buying and mechanical hedging rather than informed flow. High option-to-stock volume before earnings announcements has historically predicted lower, not higher, announcement returns in aggregate.
How many signals should confirm before you trade on volume?
At minimum, three filters should align: a V/OI ratio above 2.0, rising open interest confirming new positioning, and aggressive fills or sweep orders. Clustering across adjacent strikes adds a fourth layer of confirmation that significantly improves signal reliability.