
The risk-reward ratio measures how many dollars you stand to gain for every dollar you put at risk on a trade. The practical rule: set your stop-loss and profit target before you enter, and treat 1:2 as a reasonable floor, not a ceiling. A tool like MorningOptions can help by surfacing defined-risk options ideas with entry and exit levels already mapped out, so you're applying this math instead of guessing at it mid-trade.
TL;DR:
- A 1:2 risk-reward ratio is a practical minimum, but more aggressive setups like 1:3 require a win rate above 25 percent to remain profitable.
- Effective position sizing and managing spreads, slippage, and commissions are critical to maintaining the intended risk-reward profile when trading.
- Using defined-risk options and setting stops at logical support or volatility levels help preserve the risk-reward structure and avoid arbitrary targets.
- Journal and track real win rates and expectancy to verify if your strategy stays profitable over multiple trades, not just on paper.
- Daily trading routines should include pre-set entry, stop, and target levels to prevent emotional or impulsive decision-making during the trade.
Table of Contents
- What Is the Risk-Reward Ratio and How Do You Calculate It?
- How Win Rate and Expectancy Decide If a Ratio Actually Works
- How Much Should You Risk Per Trade?
- Why Forcing a Favorite Ratio Backfires
- Common Mistakes That Wreck Good Risk-Reward Math
- Calculators and a Simple Way to Journal Your Trades
- Three Worked Examples You Can Reuse
- How We Apply Risk-Reward Math in Our Daily Briefings
- Turn This Math Into a Daily Trading Routine
- Sources
What Is the Risk-Reward Ratio and How Do You Calculate It?
The risk-reward ratio compares two distances: how far your stop-loss sits from your entry (your risk) versus how far your profit target sits from your entry (your reward). A 1:2 ratio means you're risking $1 to make $2. A 1:3 ratio means $1 at risk for a shot at $3.
You'll see this expressed two ways. The ratio format (1:2, 1:3) is the most common shorthand. The other is the R-multiple, where "R" equals your initial risk in dollars, and outcomes get scored relative to that unit, like +2R for a full winning trade or −1R for a trade that hits your stop. Trading in R-multiples lets you compare a stock trade against an options trade or a forex position on equal footing, since the dollar amounts don't have to match.
Here's the calculation, step by step:
- Set your entry price. Say you buy a stock at $50.
- Set your stop-loss based on where the trade thesis breaks, not an arbitrary percentage. If that's $48, your risk is $2 per share.
- Set your profit target where price has a real reason to react, such as prior resistance at $56. Your reward is $6 per share.
- Divide reward by risk. $6 ÷ $2 = 3, so this is a 1:3 setup.
- Convert to dollars by multiplying by share count. On 100 shares, you're risking $200 to make $600.
That's the raw math. Real trading has friction. Spreads, commissions, and slippage eat into your reward and can widen your effective risk, so a 1:2 setup on paper sometimes performs closer to 1:1.7 once costs are factored in.
How Win Rate and Expectancy Decide If a Ratio Actually Works
A great-looking ratio means nothing if you can't hit your target often enough to cover your losers. That's where breakeven win rate comes in, and it's the single most underused calculation in retail trading.
The formula is simple: breakeven win rate = 1 ÷ (1 + R), where R is your reward-to-risk multiple. At a 1:2 ratio, that's 1 ÷ 3, or 33.33%. Win one out of three trades at that ratio and you break even before costs. Win more than that, and you're profitable.
Pro Tip: A 1:3 setup only needs to win 25% of the time to break even. That means you can be wrong three out of four times and still not lose money, assuming you're disciplined about cutting losers fast.
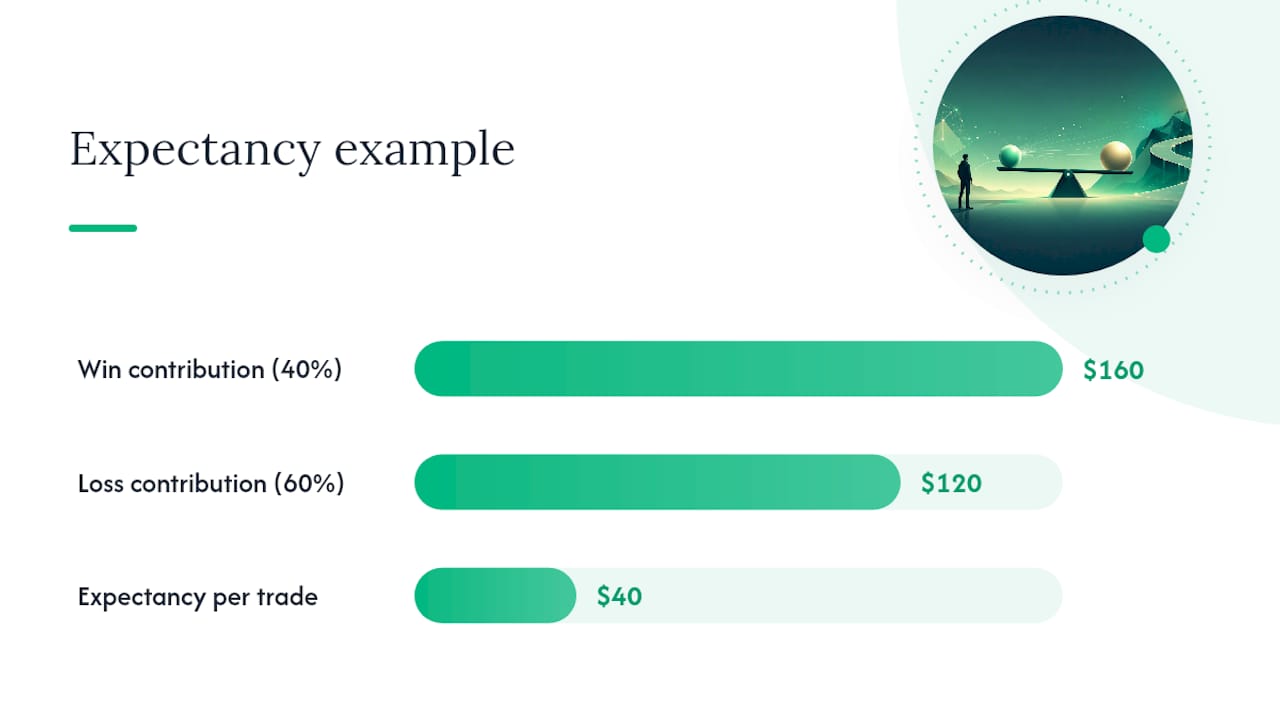
Expectancy takes this a step further by folding in your actual win rate: Expectancy = (Win Rate × Average Win) − (Loss Rate × Average Loss). If you win 40% of the time at a 1:2 ratio, risking $200 to make $400, your expectancy per trade is (0.40 × $400) − (0.60 × $200) = $160 − $120 = $40 positive. That's the number that tells you whether a strategy is worth trading at all, not just whether individual trades look attractive. And it's still a pretax number; broker fees and spread shave a little off both sides.
How Much Should You Risk Per Trade?
Your risk-reward ratio only protects your account if your position size is sane. A brilliant 1:3 setup can still blow up your month if you sized it too large.
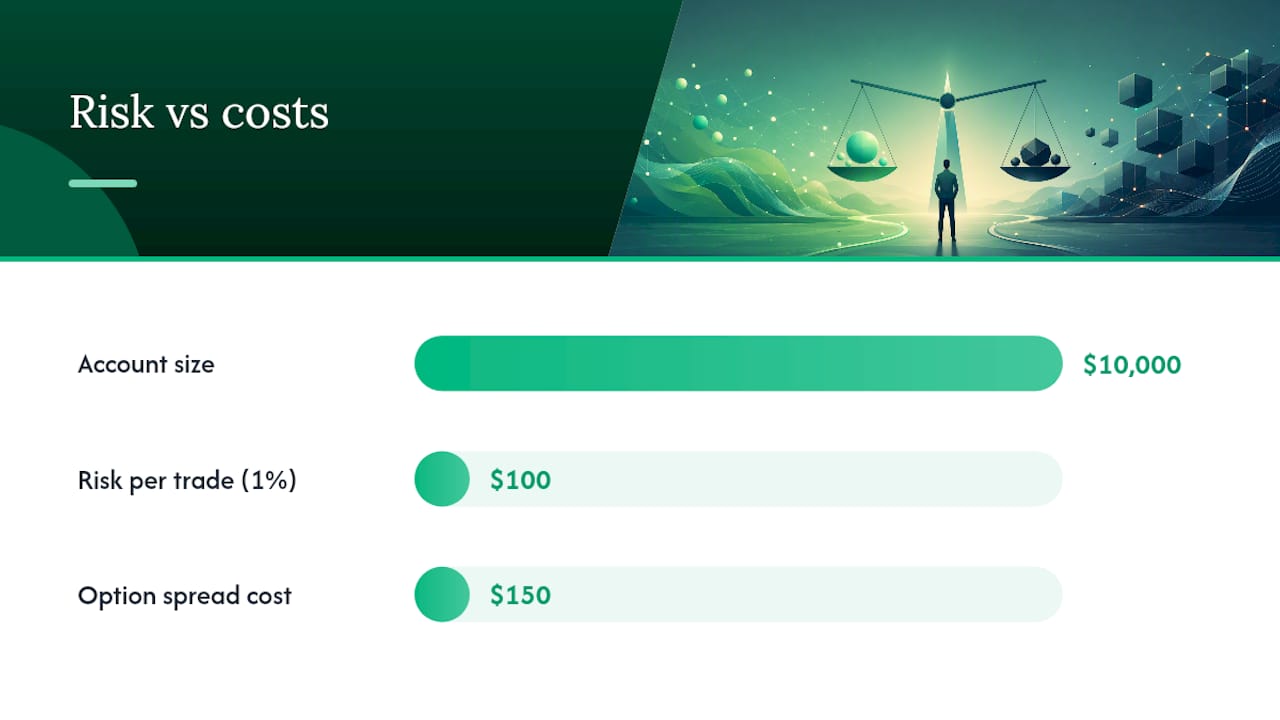
The formula: Position Size = (Account Size × Risk %) ÷ Distance to Stop-Loss. Most disciplined traders cap risk per trade at 1% to 2% of account size, full stop.
- Stock example. A $10,000 account risking 1% puts $100 on the line per trade. If your stop is $2 away from entry, your position size is $100 ÷ $2 = 50 shares.
- Larger stop example. Same $10,000 account, same 1% risk, but now your stop is $5 away. Position size drops to $100 ÷ $5 = 20 shares. Wider stops mean smaller positions, automatically.
- Defined-risk options example. Buying a call or a debit spread caps your max loss at the premium paid. If a spread costs $150 and your 1% risk budget is $100, you either skip it, size down to a partial spread where your platform allows, or accept that this idea doesn't fit your risk budget this week.
MorningOptions builds its daily briefings around this exact logic. Every idea lists a defined maximum loss up front, so instead of running that math yourself under time pressure before the open, you're plugging a known number into your position-size formula and moving on. Position sizing isn't glamorous, but it's the mechanism that turns correct R:R math into an account that survives a five-trade losing streak instead of one that doesn't.
Why Forcing a Favorite Ratio Backfires
A lot of traders decide they "only take 1:3 setups" and then stretch their profit target arbitrarily to hit that number. That's backwards. The ratio should fall out of where price is actually likely to go, not the other way around.
Your stop belongs at the point where your trade thesis is proven wrong, based on structure or volatility, not a round percentage. A stop under a swing low or beyond a volatility band tells you something real. A stop set at "2% below entry" because that's your rule tells you nothing about the chart.
Your target works the same way. It should sit at a level where the market has a documented reason to react, like a prior high, a supply zone, or a Fibonacci confluence, not wherever gets you to 1:3 on paper.
- Stretching a target further than structure supports usually lowers your probability of hitting it, even though the ratio number looks better.
- A modest 1:1.5 setup with a 55% real win rate often outperforms a flashy 1:4 setup that hits 15% of the time.
- Trailing stops change the equation entirely: your planned R at entry might be 1:2, but a trailing stop that locks in gains as price moves can turn a winner into +3R or +4R realized, well past what you planned.
The gap between planned R and realized R is exactly why journaling matters, and why artificially inflating a ratio to make a setup look better on paper tends to degrade your actual expectancy rather than improve it.
Common Mistakes That Wreck Good Risk-Reward Math
Most traders don't fail because they picked a bad ratio. They fail because they don't follow the plan they set.
- Don't move your stop after entry. Widening a stop mid-trade because "it'll probably come back" turns a 1:2 setup into a coin flip with worse odds. Use pending orders or platform-native stop/target fields to remove the temptation entirely.
- Think in dollars, not just percentages. A 2% stop on a $5,000 account and a 2% stop on a $50,000 account are wildly different dollar risks. Know the actual number before you click buy.
- Factor in spread and slippage. Your calculated 1:2 ratio at order entry can quietly become 1:1.6 once the spread and fees are subtracted.
- Journal every trade. Without a record of your actual win rate, you're guessing at your own expectancy instead of calculating it.
Calculators and a Simple Way to Journal Your Trades
You don't need custom software to run this math, but a few tools speed things up considerably.
- Risk-reward calculators take entry, stop, and target and spit out the ratio and dollar amounts instantly. Most broker platforms have one built into the order ticket.
- Position-size calculators take account size, risk percentage, and stop distance and return the exact share or contract count to trade.
- Your order ticket itself should show stop and target distances before you submit, the same way MT5-style platforms display distance-to-stop in real time.
For journaling, track five fields per trade: entry price, stop price, target price, R-multiple result, and a one-line note on why you entered. That's enough to calculate your real win rate and expectancy after 20 to 30 trades. If you want a deeper look at how the profit-and-loss math flows through an entire options position, the options profit/loss workflow breaks down each step. MorningOptions' daily briefings already log entry, stop, and target for every idea, which cuts a chunk of manual journaling out of the process for active options traders.
Three Worked Examples You Can Reuse
Numbers stick better than theory. Here are three quick walkthroughs across different instruments.
- Stock trade. Entry $80, stop $77 (risk $3), target $89 (reward $9). That's a 1:3 ratio. On a $20,000 account risking 1% ($200), position size is $200 ÷ $3 = 66 shares.
- Defined-risk options trade. A debit spread costs $250 to open with a max profit of $550 if it hits full value. Risk is capped at $250, reward is $550, giving roughly a 1:2.2 ratio. There's no stop-loss order needed since the defined-risk structure caps the downside by design, similar to the defined-risk trade structures traders use to know their max loss before entry.
- Forex/crypto trade. Entry at 1.2000, stop at 1.1950 (50 pips risk), target at 1.2150 (150 pips reward), a clean 1:3. Add a 2 pip spread on entry and exit and your effective risk grows to 52 pips, nudging the real ratio closer to 1:2.9. For more worked examples across these asset classes, the position-sizing walkthroughs for crypto and forex cover several scenarios in detail.
| Instrument | Risk | Reward | Ratio | Note |
|---|---|---|---|---|
| Stock | $3/share | $9/share | 1:3 | 66 shares at 1% risk on $20K |
| Options (debit spread) | $250 max loss | $550 max profit | 1:2.2 | Defined-risk, no stop order needed |
| Forex | 50 pips (52 with spread) | 150 pips | 1:2.9 effective | Spread narrows the real ratio |
How We Apply Risk-Reward Math in Our Daily Briefings
MorningOptions runs every trade idea through a five-AI pipeline before it reaches a subscriber's inbox. Each stage checks a different angle: catalyst relevance, technical setup, options chain liquidity, defined-risk structure, and a bear-case stress test. Ideas that survive all five get ranked, and every ranked idea ships with an entry level, a stop or invalidation point, and a target, so the R:R math is already done before the market opens.
We filter out setups where the defined risk is fuzzy or the reward doesn't clear a reasonable threshold relative to that risk. That's the same discipline covered above, just applied at scale, every trading morning, across whatever tickers are showing real catalysts that day.
— Customer
Turn This Math Into a Daily Trading Routine
Running risk-reward math by hand every morning before the open is doable, but it's slow, and slow costs you good entries. MorningOptions is built to hand you the finished math instead of the raw ingredients: every idea in the daily briefing already lists entry, stop, and target, so you're checking the setup against your own risk tolerance instead of building it from scratch under time pressure.

The free daily briefing gets you a set number of ranked ideas each morning with that structure intact. The Pro tier, at $89 a month, unlocks the full briefing list, the lunchtime scanner for midday setups, and Signal Lab, an AI chat scanner for researching any ticker on demand instead of waiting for the next scheduled scan. If you've read this far, you already understand why defined risk and a clear target matter more than a gut feeling. Check today's briefing and see the ranked ideas for yourself before the next open.
Sources
- Risk and Reward Ratio: A Day Trading Guide (2026) — TradingSim
- How to Use the Risk-Reward Ratio in Investing — Binance Academy
- Risk-Reward Ratio in Trading: Meaning & Examples — FXPrimus