
The fastest accurate options P&L workflow runs like this: collect your inputs, run them through a calculator or spreadsheet, stress-test implied volatility and days to expiration, size the position to your account risk, and lock in your exit rules before you touch the order ticket. That sequence takes under five minutes for a single-leg trade and under ten for a spread.
Three tools cover most situations:
- Web calculator (OptionsProfitCalculator at optionsprofitcalculator.com): best for quick single-leg and multi-leg checks with an interactive payoff chart and crosshair readout. Free, no login.
- Broker tool (moomoo's built-in P&L calculator): pulls live chain data directly, so premiums stay current. Best when you are already in the platform and ready to size.
- Spreadsheet template (Excel or Google Sheets): slowest to set up, but gives you full control over commissions, dividends, and custom scenarios. Best for traders who run the same strategy repeatedly.
Pro Tip: Before you run any calculation, confirm three things: you are using the per-share premium (not per-contract), you have multiplied by 100 for the contract value, and your breakeven formula includes the full round-trip commission. Skipping any one of these is the most common source of P&L errors for retail traders.
Key Takeaways
A correct options P&L workflow always runs inputs through a model, stress-tests IV and DTE, sizes contracts to max loss, and sets exit rules before the order is placed.
| Point | Details |
|---|---|
| Collect all inputs first | Gather underlying price, strike, premium, DTE, IV, contracts, and commissions before opening any calculator. |
| Model expiry and mark-to-market | Run both an expiration snapshot and a today-line scenario for any trade you plan to exit early. |
| Size to max loss | Divide your per-trade risk budget by max loss per contract and round down to get your contract count. |
| Stress-test IV and DTE | Shift IV ±20–30% and check P&L at the midpoint DTE before every entry. |
| Set exits before placing | Write take-profit, stop-loss, and time-exit rules in your journal before the order goes in. |
Table of Contents
- What does a step-by-step options profit loss calculation workflow look like?
- Core P&L formulas and worked examples for calls, puts, and spreads
- How to build a combined P&L diagram for multi-leg strategies
- How to run simulations and stress-test your assumptions
- Transaction costs, assignment risk, and U.S. tax basics you cannot ignore
- Which tools should you use for options P&L calculations?
- How to turn calculator outputs into actual trading decisions
- How Morningoptions integrates with your P&L workflow
- What a real daily workflow looks like for an active options trader
- Sources
What does a step-by-step options profit loss calculation workflow look like?
A repeatable workflow prevents the most expensive mistakes: entering a trade with the wrong breakeven in your head or sizing up without knowing your true max loss. Here is the sequence, start to finish.
Step 1: Define the strategy and collect inputs.
Before opening a calculator, write down every input you need. For a single-leg trade: underlying price, strike price, option type (call or put), premium paid or received (per share), number of contracts, commission per contract, days to expiration, current implied volatility, and whether the underlying pays a dividend near expiration. For multi-leg strategies, repeat this for each leg and note whether each leg is long or short.
Step 2: Choose your pricing model and tool.
For most retail workflows, a web calculator or broker tool handles model selection automatically, using Black-Scholes or a binomial model depending on whether the option is American or European style. The Cboe options calculator uses these models and reports Greeks alongside theoretical price. If you are building a spreadsheet, you need to decide: are you modeling the expiration snapshot (intrinsic value only) or mark-to-market (theoretical value at a future date before expiry)? Use the expiration snapshot for defined-risk trades you plan to hold to expiry. Use mark-to-market modeling when you expect to exit early, which is most of the time on short premium trades.
Step 3: Enter inputs and run the base case.
Load your strike, premium, and expiration into the tool. Confirm the output matches your mental math on breakeven before going further. A mismatch here usually means a data-entry error on the premium or strike.
Step 4: Run sensitivity checks.
Move DTE to the midpoint of your expected holding period. Check what happens to theoretical value and Greeks at each scenario. This is where most retail traders skip steps and pay for it later.
Step 5: Size the position.
Use your modeled max loss to determine contracts. The formula: contracts = (account value × risk %) ÷ max loss per contract. A trade vetting process that includes this step before every entry reduces allocation errors significantly.
Step 6: Validate before executing.
Run through this checklist before placing the order:
- Breakeven matches your expected price target window
- Max loss is within your per-trade risk budget
- Max profit is realistic given current IV and DTE
- Probability of profit (POP) aligns with your strategy type
- Expected value (EV) is positive: EV = (POP × max profit) − ((1 − POP) × max loss)
- Exit rules are written down: take-profit level, stop-loss level, and time-based exit
Core P&L formulas and worked examples for calls, puts, and spreads
These are the formulas every options trader should have memorized or within arm's reach. Per Investopedia's call option breakdown, the payoff and profit mechanics for buyers and sellers are straightforward once you separate payoff (intrinsic value at expiry) from profit (payoff net of premium).
Call and put formulas
Long call buyer:
- Payoff = max(0, Spot − Strike)
- Profit = Payoff − Premium paid
- Breakeven = Strike + Premium paid
Short call seller:
- Profit = Premium received − max(0, Spot − Strike)
- Max profit = Premium received (capped)
- Max loss = Theoretically unlimited
Long put buyer:
- Payoff = max(0, Strike − Spot)
- Profit = Payoff − Premium paid
- Breakeven = Strike − Premium paid
Short put seller:
- Profit = Premium received − max(0, Strike − Spot)
- Max profit = Premium received
- Max loss = Strike − Premium received (substantial)
All figures above are per share. Multiply by 100 for one standard U.S. equity options contract. Per moomoo's calculation guide, the full manual sequence is: identify option type, compute intrinsic value at target price, multiply by 100, then subtract or add the premium depending on whether you are the buyer or seller.
Worked example 1: Long call
- Underlying: $150
- Strike: $155 call
- Premium paid: $3.00/share ($300/contract)
- Commission: $0.65/contract
- DTE: 30 days
At expiry with underlying at $162:
- Payoff = $162 − $155 = $7.00/share
- Profit = $7.00 − $3.00 = $4.00/share
- Net profit (1 contract) = ($4.00 × 100) − $0.65 = $399.35
- Breakeven = $155 + $3.00 = $158.00
Worked example 2: Short call (covered)
- Underlying owned at $150; sell $160 call
- Premium received: $2.50/share ($250/contract)
- Commission: $0.65/contract
At expiry with underlying at $165 (assigned):
- Shares called away at $160; gain on stock = $10.00/share
- Premium kept = $2.50/share
- Total gain = $12.50/share = $1,250/contract (gross), minus commissions
At expiry with underlying at $155 (expires worthless):
- Premium kept = $2.50/share = $249.35/contract net
Worked example 3: Bull call debit spread
- Buy $150 call at $5.00; sell $160 call at $2.00
- Net debit = $3.00/share ($300/contract)
- Commission: $1.30/contract (two legs)
Net debit spread max profit = (width of strikes − net debit) × 100 = ($10 − $3) × 100 = $700. Max loss = net debit × 100 = $300, plus commissions.
Gross figures never tell the full story. Always subtract round-trip commissions from max profit and add them to max loss to get the net P&L you will actually see in your account.
How to build a combined P&L diagram for multi-leg strategies
A profit-loss diagram plots underlying price on the horizontal axis and profit or loss per share on the vertical axis. Fidelity's diagram guide describes how these charts reveal profit potential, risk, and breakeven points across any strategy. For multi-leg trades, you build the diagram by summing each leg's payoff at every price point in a grid.
Step sequence:
- Set your price grid: choose a range that covers the underlying's realistic move (typically ±30–40% from current price, or from key support to key resistance). Use $1 or $0.50 increments for stocks under $100; $2.50 or $5 increments for higher-priced underlyings.
- For each price in the grid, calculate each leg's payoff using the formulas above.
- Sum all leg payoffs at each price point to get the combined P&L row.
- Multiply per-share figures by 100 (and by number of contracts) to get dollar P&L.
- Plot or export the combined column as your payoff diagram.
Pro Tip: When using a web calculator, trust the crosshair readout for exact dollar values at a specific underlying price. The zero line crossing tells you the breakeven; any date-overlay lines above or below it show how time decay shifts your position value before expiry.
Iron condor example
Sell $145 put, buy $140 put, sell $160 call, buy $165 call. Net credit = $2.00/share ($200/contract).
| Underlying at Expiry | Combined P&L (per share) |
|---|---|
| — | −$3.00 |
| $140 | −$3.00 |
| $143 | lower breakeven |
| $150 | +$2.00 (max profit) |
| $158 | upper breakeven |
| $160 | −$3.00 |
| $165 | −$3.00 |
Max profit = net credit = $2.00/share. Max loss = wing width − net credit = $5.00 − $2.00 = $3.00/share. Breakevens = $145 − $2.00 = $143 and $160 + $2.00 = $162 (adjusted for the credit received on each side).
Chart features worth trusting: crosshair readout at any price, the zero line, and multiple-date overlays that show how theta erodes the position over time. Be skeptical of any diagram that does not show a today-line alongside the expiration line, since most short premium trades get closed well before expiry.
How to run simulations and stress-test your assumptions
A single P&L snapshot at one IV level and one DTE is almost never enough. Markets move, volatility spikes, and time passes faster than expected. The Fidelity P&L Calculator guide describes how a proper calculator lets you change IV and DTE via sliders and view an interactive chart that updates in real time.
The four simulation knobs that matter:
- Implied volatility scenarios. Shift IV up 20–30% and down 20–30% from current. For long options, an IV drop (vol crush) after earnings can wipe out gains even when the underlying moves in your direction. For short premium, an IV spike is the primary risk.
- Days to expiration. Model P&L at entry DTE, at the midpoint, and at expiry. Theta decay accelerates in the final 21 days for most strategies, so the midpoint check often reveals a better exit window.
- Underlying price scenarios. Test the position at current price, at your target, at your stop, and at a 2-standard-deviation move in both directions.
- Interest rate and dividend adjustments. For longer-dated options or dividend-paying stocks, a dividend ex-date near expiry can shift put values meaningfully. Most web calculators omit this by default.
Reading the Greeks:
- Delta: how much the option's value changes per $1 move in the underlying. Most important for directional trades.
- Gamma: rate of change of delta. High gamma near expiry means your delta exposure can shift fast on a big move.
- Theta: daily time decay in dollar terms. The number that tells short premium sellers how much they earn per day the underlying stays still.
- Vega: sensitivity to a 1-point change in IV. Most important around earnings or macro events. Model IV up/down scenarios around earnings rather than relying on a single IV snapshot, since vega exposure can dominate all other Greeks in those windows.
Scenario checklist before every trade:
- IV up 20%: does max loss change materially for defined-risk trades? (It should not for spreads, but it matters for naked positions.)
- IV down 20%: does theoretical value collapse before you reach your profit target? (Critical for long premium trades.)
- DTE at midpoint: is there still enough premium left to justify holding, or is the position better closed early?
- Fast move (gap open ±5%): does the position survive, and what does gamma do to your delta?
- Stress case (2 SD move): is max loss still within your account risk budget?
The Cboe options calculator reports Greeks alongside theoretical price, making it a reliable reference for sensitivity checks when you want to verify a broker tool's output against an independent model.
Transaction costs, assignment risk, and U.S. tax basics you cannot ignore
Calculators and broker tools often omit commissions, dividends, and taxes in their default displays, so traders must add these manually to arrive at net P&L. The Fidelity calculator user guide flags this explicitly. Here is what to always include:
Costs to add to every calculation:
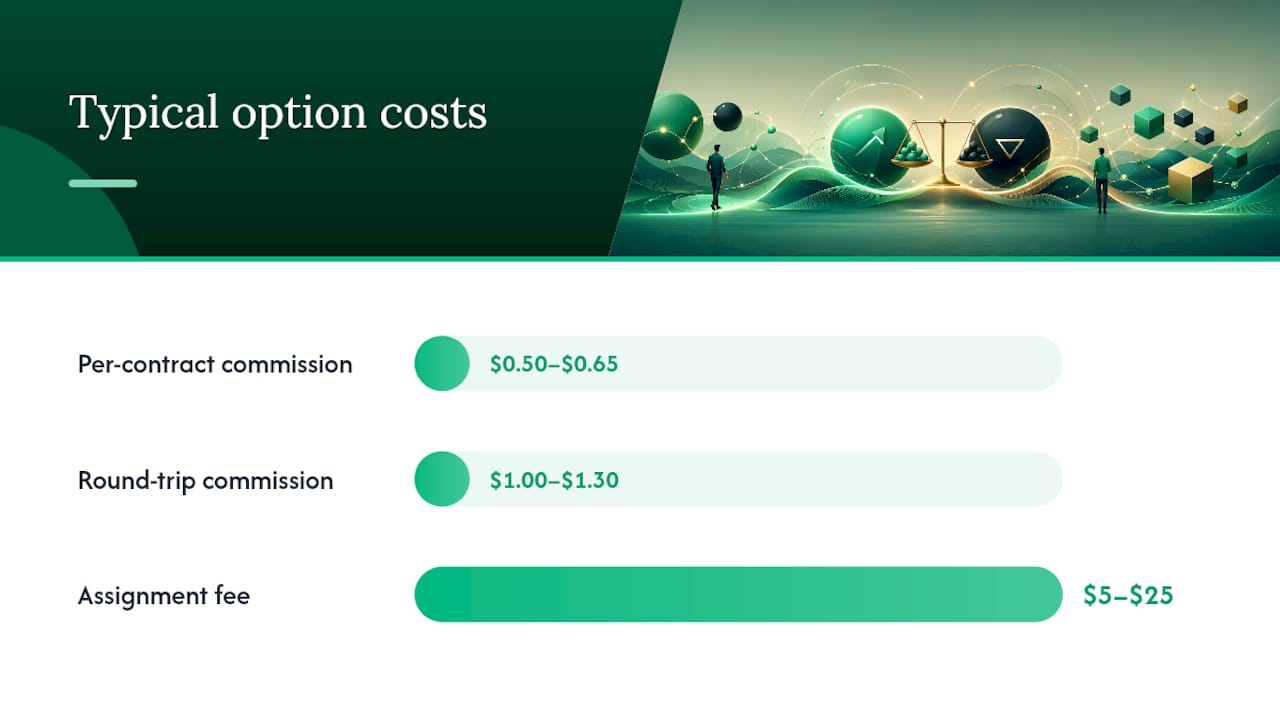
- Per-contract commission (typically $0.50–$0.65 at major U.S. brokers, but verify your rate)
- Exchange and regulatory fees (OCC, SEC, FINRA — usually a few cents per contract)
- Bid/ask spread slippage: for illiquid strikes, assume you fill at the ask when buying and at the bid when selling. Model the mid as your theoretical value but budget for a half-spread slippage on each leg.
- Assignment fee: some brokers charge $5–$25 per assignment event. Check your broker's schedule.
Assignment risk for short options:
American-style equity options can be assigned at any time before expiry, not just at expiration. Early assignment is most likely when a short call is deep in the money and the underlying is about to pay a dividend, or when a short put is deep in the money and the holder wants to capture the stock. Model the assignment outcome explicitly: if your short call is assigned, you deliver 100 shares at the strike. If you hold the underlying (covered call), your net outcome is strike price + premium received. If you are naked, you need to buy shares at market to deliver, which can produce a loss larger than your modeled max loss if the stock has gapped.
Margin and position sizing:
Naked short options require margin. The effective risk on a naked short put is not just the premium received; it is the strike price minus the premium, times 100, times contracts. Margin requirements can change intraday during volatile sessions, which affects your available buying power and can force an early close at an unfavorable price.
Pro Tip: Add a "cost-adjusted breakeven" line to every spreadsheet: breakeven (from formula) plus total round-trip commissions divided by 100. That is the price the underlying actually needs to reach for you to break even after all costs.
U.S. tax note: Options gains are generally treated as short-term capital gains when held under a year, taxed at ordinary income rates. Assignment and exercise events have their own cost-basis implications. This is general information, not tax advice. Confirm your specific situation with a qualified tax professional before year-end.
Which tools should you use for options P&L calculations?
The right tool depends on what you are doing. Speed, transparency, and control pull in different directions, and no single tool wins on all three.
OptionsProfitCalculator (optionsprofitcalculator.com): Best for quick single-leg and multi-leg checks with no login. The interactive payoff chart includes a crosshair readout and supports common spread structures. It does not pull live chain data automatically, so you enter premiums manually. Good for pre-market modeling when you already have a quote.
MarketBeat Options Profit Calculator (marketbeat.com): Straightforward interface for single-leg calculations with breakeven and max profit/loss outputs. Useful for quick sanity checks and for traders who use MarketBeat for research and want everything in one tab.
moomoo P&L calculator: Integrated directly into the moomoo platform, so it pulls live chain data and keeps premiums tied to current bid/ask rather than stale theoretical values. Reduces manual entry errors. Best when you are already in the platform and close to placing a trade.
Broker-native tools (TD Ameritrade thinkorswim, Tastytrade, Schwab): These offer the deepest integration: live chain import, multi-leg strategy builders, Greeks display, and sometimes probability cones. The tradeoff is that you are modeling inside the same platform where you trade, which can create confirmation bias toward placing the trade.
Excel or Google Sheets template: Full control over every assumption, including custom commission schedules, dividend adjustments, and scenario tables. The slowest to set up but the most transparent. Build one template per strategy type and reuse it. For tracking options trades systematically, a spreadsheet that logs modeled vs. actual P&L is hard to beat.
Features to require in any tool you use regularly:
- Live option chain import or easy manual entry with bid/ask fields
- Interactive payoff chart with crosshair readout and zero-line
- IV and DTE sliders for scenario testing
- Greeks display (delta, gamma, theta, vega) tied to the current inputs
- Export to CSV or copy-paste to spreadsheet
- Visible model disclosure (Black-Scholes or binomial)
Build your own spreadsheet when you need full auditability, run the same strategy repeatedly, or want to automate position sizing alongside P&L. Use a web calculator when speed matters and you need a visual payoff diagram fast. Use a broker tool when you are minutes from placing the trade and want live data.
How to turn calculator outputs into actual trading decisions
Numbers from a calculator only matter if they change what you do. Here is how to convert outputs into concrete rules.
Position sizing from max loss:
- Decide your per-trade risk: most active traders use 1–3% of account value per position.
- Pull the max loss per contract from your calculator (include commissions).
- Divide: contracts = (account value × risk %) ÷ max loss per contract.
- Round down. Never round up on position sizing.
Bull call spread with $301.30 max loss per contract: $1,000 ÷ $301.30 = 3.3 contracts. Trade 3 contracts.
Decision rules to set before entry:
- Take-profit: for defined-risk short premium trades, close at 50% of max profit. For long premium, set a dollar target based on your modeled P&L at the target underlying price.
- Stop-loss: for defined-risk trades, close at 2× the credit received (i.e., if you sold a spread for $2.00, close if it reaches $4.00 debit). For long premium, close if the position loses 50% of premium paid.
- Time exit: close any short premium position with fewer than 21 DTE remaining unless you have a specific reason to hold through expiry.
Common interpretation errors:
- Over-relying on POP alone. A 70% POP trade with a 3:1 loss-to-win ratio has a negative expected value. Always pair POP with EV. Per TradeAlgo's options calculator guide, EV = (POP × max profit) − ((1 − POP) × max loss). If EV is negative, the trade is not worth taking regardless of POP.
- Ignoring vega exposure. A long straddle before earnings looks attractive on a payoff diagram. But if IV collapses after the announcement, the position can lose money even on a large move. Model the IV-down scenario before entry.
- Misreading breakevens. The breakeven formula gives you the price at expiry. If you plan to exit early, your effective breakeven is different and depends on theta and vega. Use mark-to-market modeling for any trade you expect to close before expiry.
Pro Tip: Before placing any trade, write three lines in your journal: entry trigger, take-profit price, and stop-loss price. Then paste the calculator's max profit, max loss, and breakeven next to them. If you cannot fill in all five fields, you are not ready to trade the position.
How Morningoptions integrates with your P&L workflow
Morningoptions delivers ranked trade ideas with specific contract details, entry levels, target prices, and bear case analysis every market morning. That pre-work cuts the discovery phase of the workflow to near zero and feeds directly into the calculation steps.
Here is how the integration works in practice:
- Receive the briefing. Each idea includes the underlying, the specific contract (strike, expiration), entry level, target, and bear case. These are your P&L inputs, already assembled.
- Load into your calculator or sheet. Enter the strike, expiration, and current premium (pull live from your broker chain). Run the base-case P&L.
- Model expiry and mark-to-market scenarios. Use the target price from the briefing as your profit scenario and the bear case as your stress scenario. Run IV up/down 20% around each.
- Size per account risk. Apply the contracts formula above using the modeled max loss.
- Set automatic rules. Write take-profit and stop-loss orders before the open. For options strategies built for busy schedules, pre-set orders remove the need to monitor intraday.
The Signal Lab inside Morningoptions Pro ($89/mo) lets you run on-demand scans for specific tickers, which is useful when you want to model a position outside the morning briefing or re-run scenarios after a midday move. The full options chain data inside the platform keeps premiums current, so you are not modeling with stale quotes.
Pro Tip: After modeling any Morningoptions idea, save the output (max profit, max loss, breakeven, IV assumption, DTE) in your trade journal alongside the entry. When you close the trade, log the actual P&L next to the modeled P&L. Over 20–30 trades, the gap between modeled and actual tells you exactly where your assumptions are off — usually slippage or IV assumptions.

What a real daily workflow looks like for an active options trader
Pre-market, before the open: pull the Morningoptions briefing, pick one or two ideas that fit the day's risk budget and model each in a calculator. The whole sequence takes three to four minutes per position. Write the breakeven, take-profit, and stop-loss in the journal before the open bell.
At entry, confirm the live premium is within $0.10–$0.15 of what you modeled. If it has moved more than that, re-run the calculation with the new premium before filling. A $0.30 premium difference on a 5-contract trade is $150 of unmodeled risk.
Midday, if the position is open: check the mark-to-market value against the modeled today-line from the payoff diagram. If the underlying has moved against you and the position is near the stop-loss level, close it without negotiating with yourself.

Before expiration week: re-run the full scenario analysis with the updated DTE and current IV. Gamma risk accelerates sharply in the final week, and a position that looked fine at 30 DTE can move against you fast at 7 DTE. If you are holding a short premium position into the final week without a specific reason, that is a risk management gap, not a strategy.
Sources
- Options calculator and tools | Cboe
- Call option | Investopedia
- Options Profit Calculator: How to Model Any Trade | TradeAlgo
This article is general information, not a substitute for advice from a qualified financial advisor. Consult a qualified financial professional about your own circumstances before acting on anything here.