
Risk-adjusted return measures how much profit an investment generates per unit of risk taken. The most common ways to calculate it are the Sharpe ratio, the Sortino ratio, the Treynor ratio, and the Modigliani M2 measure. Each metric strips out the noise of raw percentage gains and asks a sharper question: did this return justify the volatility, drawdown, or market exposure it took to get there?
Two funds can post identical 12% annual returns and still be wildly different investments if one got there with half the swings. Risk-adjusted return compares that excess gain against a risk-free benchmark, usually U.S. Treasury yields, so you can put dissimilar investments on the same scale.
The main tools you'll use:
- Sharpe ratio — total volatility, general-purpose comparisons
- Sortino ratio — downside volatility only, capital preservation focus
- Treynor ratio — market risk (beta) instead of total volatility
- M2 (Modigliani) — Sharpe restated in percentage points
Practitioners rely on these ratios to gauge whether a higher return actually reflects skill or just extra risk, and a higher ratio generally signals better risk-adjusted performance, not necessarily a bigger number.
Key Takeaways
Risk-adjusted return matters because it separates genuine investment skill from returns that only look good until volatility catches up with them.
| Point | Details |
|---|---|
| Definition anchors everything | Risk-adjusted return compares excess gain over a risk-free rate against the volatility taken to earn it. |
| Match the metric to the goal | Use Sharpe for general comparisons, Sortino for capital preservation, Treynor for market-exposure evaluation. |
| Consistency beats precision | Compare investments using the same metric, risk-free rate, and time window every time. |
| Non-normal returns need care | Options and concentrated strategies often need downside-focused metrics instead of standard deviation. |
| Numbers need context | A Sharpe above 1.0 is solid and above 2.0 is excellent, but always check against peers and history. |
Table of Contents
- What Is Risk-Adjusted Return and Why the Ratios Differ
- How to Calculate Risk-Adjusted Return Step by Step
- How Should You Interpret the Numbers and Avoid Pitfalls
- Using Risk-Adjusted Return to Make Investment Decisions
- How MorningOptions Applies Risk-Adjusted Thinking to Trade Scoring
- An Honest Take on Risk-Adjusted Metrics
- Frequently Asked Questions
- Sources
What Is Risk-Adjusted Return and Why the Ratios Differ
Each metric answers a slightly different question, and mixing them up is one of the fastest ways to draw the wrong conclusion about a fund.
The Sharpe ratio is the workhorse. It measures excess return per unit of total risk:
Sharpe = (Portfolio Return − Risk-Free Rate) ÷ Standard Deviation of Portfolio Returns
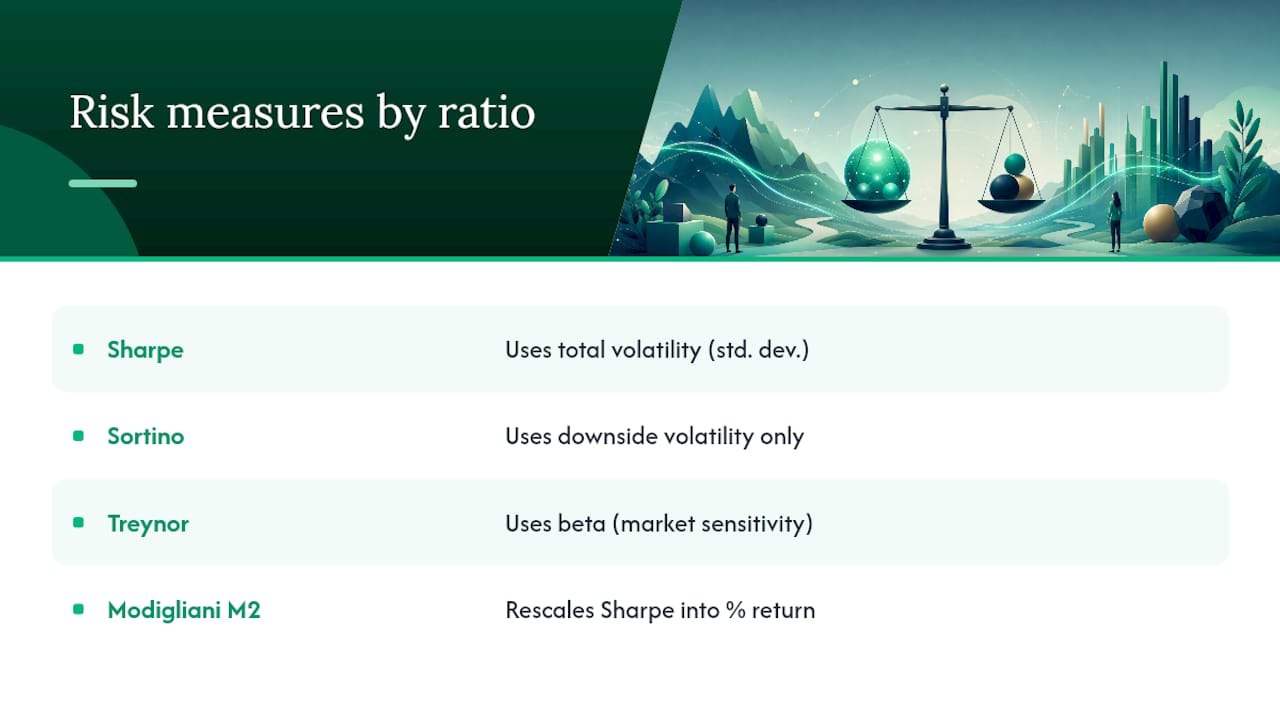
Standard deviation captures how much returns bounce around their average, both up and down. That's fine for most stock and bond portfolios, but it penalizes strategies for upside swings too, which is where the Sortino ratio comes in. Sortino swaps standard deviation for downside deviation, which only counts volatility below a minimum acceptable return. CFA Institute guidance recommends Sortino specifically for investors focused on capital preservation, since it doesn't punish a fund for having good months.
Treynor replaces total volatility with beta, the sensitivity of a portfolio to market moves:
Treynor = (Portfolio Return − Risk-Free Rate) ÷ Beta
That makes Treynor the right tool when you're evaluating a manager's skill relative to systematic market risk rather than total portfolio noise.
M2 takes the Sharpe ratio and rescales it so the output looks like an actual return figure instead of an abstract ratio. Modigliani's approach expresses risk-adjusted performance in percentage points, which is why advisors often use it when explaining results to clients who find a "1.4 Sharpe ratio" meaningless.
Pro Tip: If you only remember one distinction, remember this: Sharpe and M2 use total volatility, Sortino uses downside-only volatility, and Treynor uses beta. Picking the wrong one for your goal is the single most common mistake in performance reporting.
How to Calculate Risk-Adjusted Return Step by Step
You need three inputs to get started: a returns series for the investment, a risk-free rate (commonly a 3-month or 10-year Treasury yield), and, for beta-based or M2 calculations, a benchmark returns series like the S&P 500.
- Calculate the average return of the investment over your chosen period.
- Subtract the risk-free rate to get excess return.
- Calculate the standard deviation of the investment's returns (for Sharpe) or only the downside deviations below a target (for Sortino).
- Divide excess return by that volatility figure.
- For Treynor, calculate beta against the benchmark instead of using standard deviation.
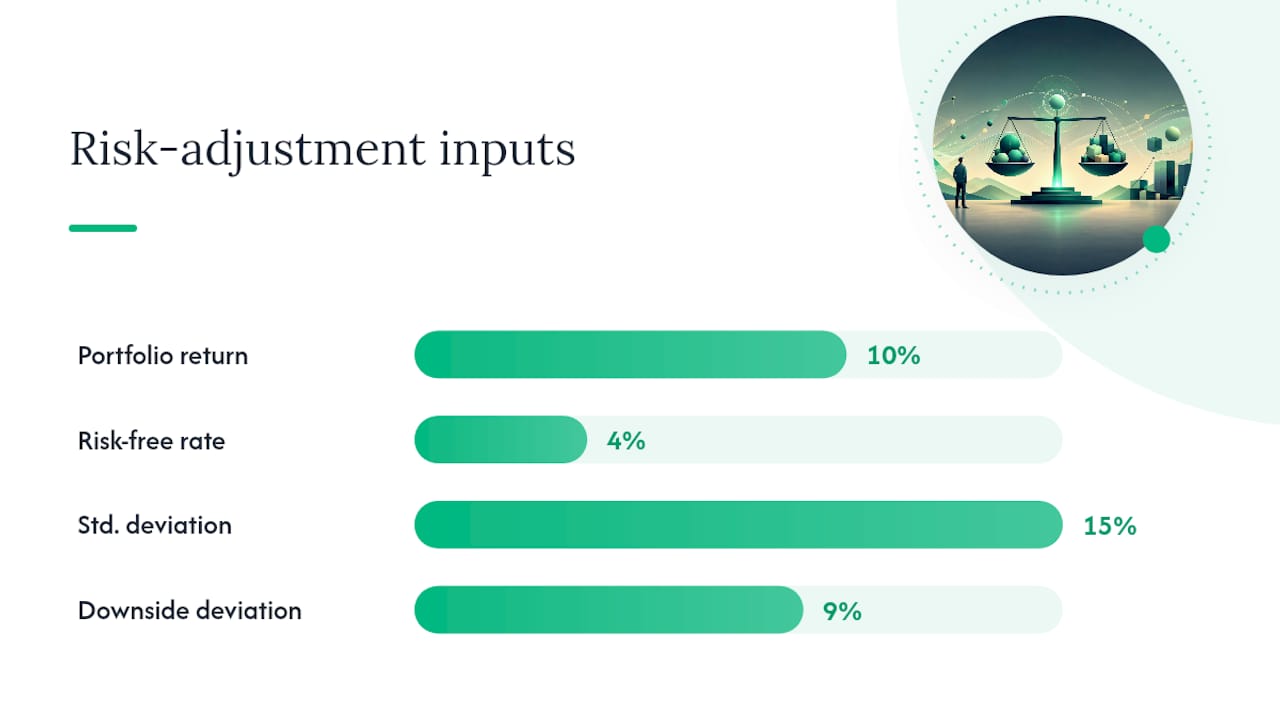
Here's a simplified worked example using annualized figures:
| Input | Value |
|---|---|
| Portfolio average return | 10% |
| Risk-free rate (T-bill) | 4% |
| Portfolio standard deviation | 15% |
| Downside deviation | 9% |
| Portfolio beta | an appropriate level for comparison purposes |
Excess return is 10% minus 4%, or 6 percentage points. Sharpe ratio: 6 ÷ 15 = 0.40. Sortino ratio using the same excess return but downside deviation: 6 ÷ 9 = 0.67. Treynor ratio: 6 ÷ 1.2 = 5.0 (expressed per unit of beta rather than as a decimal ratio).
In plain terms, a Sharpe of 0.40 is mediocre by most standards, a Sortino of 0.67 suggests the losses that did occur weren't severe relative to the gain, and a Treynor of 5.0 tells you the portfolio earned 5 percentage points of excess return for every unit of market sensitivity it carried. None of these numbers mean much alone. They only become useful once you compare them against a peer group or benchmark using the same formula and the same time window. Tracking a returns series correctly before running any of this math matters more than most people realize.
How Should You Interpret the Numbers and Avoid Pitfalls
Higher is better across all four metrics, but "good" depends heavily on asset class and time period. A Sharpe ratio above 1.0 is generally considered solid, above 2.0 is excellent, and below 0.5 usually signals the return didn't adequately compensate for the risk. Sortino values run higher than Sharpe for the same portfolio since downside deviation is typically smaller than total deviation, so never compare a Sortino score directly against a Sharpe benchmark.
A few pitfalls trip up even experienced analysts:
- Short lookback windows can make a lucky quarter look like skill.
- Inconsistent risk-free rate choices distort comparisons. Switching between short-term T-bills and 10-year Treasuries can materially change your excess-return inputs, especially in a rising-rate environment.
- Mixing metrics across compared investments, like judging one fund on Sharpe and another on Sortino, produces a false comparison.
- Non-normal return distributions, common in options strategies, break the assumptions standard deviation relies on. Historical-data limitations become especially pronounced when return distributions skew heavily, which is exactly the profile many options trades produce.
Pro Tip: Before trusting any ratio, check the lookback period and risk-free proxy the source used. Two Sharpe ratios calculated over different windows with different Treasury benchmarks are not actually comparable, even if they look like the same metric.
Using Risk-Adjusted Return to Make Investment Decisions
Raw return tells you what happened. Risk-adjusted return tells you whether it was worth the ride, and that distinction is exactly why BlackRock highlights risk-adjusted thinking as a tool for avoiding emotionally driven trading decisions rather than chasing whatever posted the biggest number last quarter.
When comparing mutual funds or ETFs with similar mandates, the same metric has to apply to every candidate. Investopedia and other finance education resources emphasize consistent application of the same measure across compared investments as a baseline rule, not an optional refinement.
A simple decision framework:
- Identify your priority: general comparison (Sharpe), capital preservation (Sortino), or market-exposure evaluation (Treynor).
- Compute the chosen metric consistently across every candidate using the same risk-free rate and window.
- Cross-check the number against qualitative factors like manager tenure, strategy concentration, and drawdown history.
For concentrated or options-heavy positions, standard deviation often misrepresents the real risk, since gains and losses aren't symmetric. Downside-focused metrics or strategies built around volatile-market conditions tend to give a clearer read than a plain Sharpe ratio in those cases.
- Use Sharpe for broad index fund or ETF shortlists.
- Use Sortino when the goal is protecting capital, such as cash flow protection strategies.
- Use Treynor when evaluating a manager's skill against systematic market risk specifically.
How MorningOptions Applies Risk-Adjusted Thinking to Trade Scoring
Options trades don't behave like a diversified equity portfolio. A single contract can have asymmetric, skewed payoff potential, which is exactly where standard deviation alone falls short. MorningOptions runs every trade idea through a five-AI pipeline that vets and scores setups before ranking them into the daily briefing, weighing expected return against downside exposure rather than raw premium potential.
- Scores account for how much a trade could lose relative to what it could gain, not just its headline return.
- Each briefing ranks ideas so traders see risk-adjusted priority at a glance, not a flat list of tickers.
- The scoring logic pairs with educational breakdowns like how options scoring models work for traders who want the mechanics.
Pro Tip: Before taking any scored trade idea, glance at its downside case the same way you'd check downside deviation in a Sortino calculation. The score already weighs it, but understanding why builds better instincts over time.
Active traders juggling a full-time job rarely have hours to run these calculations by hand every morning, which is exactly the gap this kind of daily research fills.
Ready to see risk-adjusted scoring applied to real contract ideas before the market opens? Check out MorningOptions for daily briefings, and explore the Pro tier's Signal Lab for on-demand ticker research when you need it mid-session.
An Honest Take on Risk-Adjusted Metrics
Most articles on this topic treat the Sharpe ratio as gospel and mention Sortino or Treynor as afterthoughts. That's backwards for a lot of retail traders. If your priority is not losing money on a bad month, Sortino tells you more than Sharpe ever will, and the CFA Institute's own guidance backs that framing.
The bigger blind spot is applying any of these formulas to short, choppy, options-driven returns and treating the output like gospel. A Sharpe ratio built on three weeks of contract trades isn't measuring skill. It's measuring noise. The reader's real priority shouldn't be memorizing formulas. It should be asking whether the return distribution behind the number is even the kind these ratios were built to measure. Get that right first, and the math becomes a lot more trustworthy.
Frequently Asked Questions
What is a good Sharpe ratio? A Sharpe ratio above 1.0 is generally considered acceptable, above 2.0 is strong, and anything below 0.5 suggests the return didn't compensate adequately for the risk taken.
What's the difference between Sortino and Sharpe ratios? Sharpe uses total standard deviation, penalizing both upside and downside swings. Sortino only counts downside deviation, making it better suited to capital-preservation goals.
Can risk-adjusted return be negative? Yes. A negative value means the investment underperformed the risk-free rate, so the risk taken wasn't compensated at all.
Why do options traders need different risk-adjusted metrics? Options payoffs are often asymmetric and don't follow a normal distribution, which distorts standard deviation-based metrics like Sharpe. Downside-focused measures give a more accurate picture.
Is M2 better than Sharpe? Neither is objectively better. M2 expresses the same information as Sharpe but in percentage-point terms, which many investors find easier to interpret in client conversations.
Sources
- Risk-Adjusted Return | Formula + Calculator
- Understanding Risk-Adjusted Return in Investing
- Risk-Adjusted Performance Measures | RPC (CFA Institute)