
Probability of profit (POP) is the modeled chance a specific options position finishes with any positive profit and loss at expiration, even a single cent. Most calculators estimate it by mapping the position's breakeven price onto a log-normal distribution using Black–Scholes math, or by simulating thousands of price paths with Monte Carlo methods. Neither approach predicts the future. Both give you a probability-weighted read on how a trade's structure stacks the odds.
Here's what that means in practice:
- POP tells you how often a trade structure wins, not how much it wins or loses when it does.
- It's an estimate frozen in time — recalculate it whenever price or implied volatility moves.
- High POP does not mean a good trade. A 90% POP credit spread can still lose money over time if the 10% loser wipes out nine winners.
Key Takeaways
Probability of profit estimates the odds a trade finishes above breakeven at expiration, but it always requires pairing with expected value, not treating as a standalone decision rule.
| Point | Details |
|---|---|
| POP measures breakeven odds | It's the modeled chance a position finishes with any profit, even a single cent, at expiration. |
| Two calculation methods dominate | Black–Scholes maps breakevens onto a log-normal curve; Monte Carlo simulates thousands of price paths. |
| High POP isn't automatically good | A 90% POP trade can still carry negative expected value if the rare loss is large enough. |
| Recalculate after big moves | POP is only valid for the inputs used at calculation and goes stale as price or IV shifts. |
| Morningoptions filters with POP and EV | Its daily briefings pair probability screening with expected value and defined-risk criteria before ranking ideas. |
Table of Contents
- What Does Probability of Profit Actually Measure?
- How Do You Calculate Probability of Profit?
- Worked Examples: Calculating POP by Hand
- Does POP Mean Different Things for Buyers and Sellers?
- What Are the Limits of a Probability of Profit Calculator?
- Which Tools Calculate Probability of Profit?
- How Does MorningOptions Use Probability of Profit?
- How Do Multi-Leg Strategies Change the POP Calculation?
- An Honest Take on Probability of Profit
- Get POP-Aware Trade Ideas Before the Market Opens
- Frequently Asked Questions About Probability of Profit
- Sources
What Does Probability of Profit Actually Measure?
POP measures one thing: the odds, at the moment of calculation, that a position's value at expiration lands above your breakeven. Not above zero on the chart. Above breakeven, meaning the stock's final price clears the point where your premium paid or collected nets out. A $0.01 profit still counts as a win under this definition, which trips up newer traders who expect POP to reflect meaningful profit.
Three related numbers get confused constantly:
- POP at expiration — the odds the position is profitable specifically on expiration day, ignoring what happens in between.
- Probability of touch — the odds the underlying price touches your strike or breakeven at any point before expiration, which is always higher than POP because it counts near-misses that later reverse.
- Probability of expiring in the money (ITM) — a related but distinct figure, since a call can expire ITM and still lose money if the premium paid exceeds the intrinsic value at expiration.
A long call at a $50 strike with a $2 premium needs the stock above $52 to profit. A cash-secured put at $45 with $1.50 collected profits anywhere above $43.50. A credit spread has two breakevens bounding a profit zone in the middle. Each structure defines "win" differently, which is exactly why POP has to be calculated per position, not looked up from a table. Understanding how options premium gets built from intrinsic and time value makes these breakeven calculations click faster.
How Do You Calculate Probability of Profit?
Analytic POP calculators, the kind built into most broker platforms, follow a repeatable three-step process rooted in the Black–Scholes framework:
- Compute the breakeven price(s). For a single option, that's strike plus or minus premium. For spreads, you get two breakevens bounding the profit range.
- Convert implied volatility and days to expiration into a standard deviation of expected price movement. Higher IV or more time means a wider expected range, which spreads the probability distribution thinner across possible outcomes.
- Map the breakeven(s) onto the log-normal cumulative distribution function, using the same d1/d2 terms found in the Black–Scholes formula, to find what percentage of the distribution falls on the winning side.
The required inputs are consistent across tools: underlying price, strike or strikes, implied volatility, days to expiration, risk-free interest rate, expected dividends, and net premium paid or collected.
Monte Carlo simulation takes a different route. Instead of solving a formula, it generates thousands of randomized price paths based on the stock's volatility and drift, then counts what fraction of those paths finish profitable. Traders lean on Monte Carlo for complex, multi-leg, or path-dependent payoffs where the analytic shortcut breaks down, since it can model scenarios the log-normal formula can't cleanly capture.
Every analytic POP calculation rests on assumptions worth knowing:
- Stock returns follow a log-normal distribution (no fat tails, no sudden gaps).
- Implied volatility stays constant through the life of the trade.
- No early exercise or assignment occurs before expiration.
- Commissions and slippage don't exist.
Real markets violate every one of these regularly, which is why POP is a modeling tool, not a guarantee.
Worked Examples: Calculating POP by Hand
Numbers make this concrete. Here's how the math runs for two common structures.
- Single long call. Stock trades at $100, you buy the $105 call for $3.00 with 30 days to expiration and 25% implied volatility. Breakeven sits at $108. Given the IV and time frame, the expected one standard deviation move is roughly $7 to $8, meaning $108 sits nearly one full standard deviation above the current price. Mapping that distance onto the log-normal CDF via the same analytic method exchange calculators use produces a POP in the neighborhood of 30% to 35%. The trade needs a real move to pay off, and the math reflects that.
- Short vertical credit spread. Sell the $95 put and buy the $90 put for a $1.50 net credit, same stock and expiration. Breakeven falls at $93.50. Because you're already collecting premium and the stock only needs to stay above that line, the position starts with more of the distribution on its side, often landing in the 65% to 75% POP range depending on skew.
The contrast matters: the long call needs a real move and wins less often but pays disproportionately more when it does. The credit spread wins more frequently but caps the payout tightly, an asymmetry that shows up constantly once you start comparing trade structures side by side.
Does POP Mean Different Things for Buyers and Sellers?
It does, and conflating the two is one of the most common mistakes retail traders make. Selling premium, whether credit spreads or cash-secured puts, usually produces high POP, often 65% to 85%, paired with capped, asymmetric downside.
- A 90% POP naked put sale can carry negative expected value if the rare 10% loss is large enough to erase dozens of small wins.
- A 25% POP long call can carry positive expected value if the payout on a winning move is large enough relative to the premium risked.
POP by itself tells you nothing about expected value, max loss, or the size distribution of wins and losses. Pair it always with those numbers, not instead of them. The MorningOptions guide to high probability trades walks through why "high probability" and "good trade" aren't synonyms.
What Are the Limits of a Probability of Profit Calculator?
Most POP calculators exclude the friction that actually eats into returns: commissions, bid-ask spread slippage, early assignment risk on American-style options, dividend timing, and margin effects on capital efficiency. Tastytrade's own documentation is explicit that POP is an educational estimate, not a prediction, precisely because these frictions aren't modeled.
There's also a deeper model risk. The constant-IV assumption doesn't hold in real markets, where volatility spikes around earnings or macro events. Log-normal distributions underweight the fat-tailed moves that actually happen more often than the model expects. And POP suffers from what's sometimes called the "moment in time" problem: the number is only valid for the exact inputs used at calculation, which means a POP calculated Monday morning can be meaningfully stale by Wednesday afternoon if the stock or its implied volatility has moved.
Practical adjustments help:
- Widen your assumed breakeven slightly to account for expected slippage on illiquid contracts.
- Use Monte Carlo or historical-simulation methods when you suspect skew or fat tails matter for your specific structure.
- Recalculate POP after any significant price or IV move rather than trusting the number you started with.
- Size positions conservatively to account for the gap between modeled and realized outcomes.
Pro Tip: Set a calendar reminder to re-check POP on any trade held longer than a week. IV crush or a sharp price move can shift your odds more than you'd expect, and a stale POP number is worse than no number at all.
Which Tools Calculate Probability of Profit?
Three categories cover most of what retail traders use:
- Broker-built calculators, like the free tool from TradingBlock, which walk through the standard-deviation-to-CDF workflow directly on the trade ticket.
- Platform probability tools, such as tastytrade's built-in POP display, which pairs the number with visualizations of the expected price distribution.
- Standalone POP calculators that let you plug in any strike combination independent of your broker, useful for screening ideas before you commit capital.
When comparing any tool, check five things: the model used (Black–Scholes versus Monte Carlo), the inputs it requires, whether it visualizes the breakeven and distribution, whether it accounts for early assignment or dividends, and how much manual setup it demands. Some tools slap a POP label on a number without showing the underlying breakeven math or stated assumptions, which is a red flag if you're trying to understand why a probability is what it is rather than just trusting it blindly.
How Does MorningOptions Use Probability of Profit?
POP is one filter among several in MorningOptions' daily research pipeline, not a standalone signal. Trade ideas get scored against expected value and defined-risk criteria before a POP threshold ever comes into play, because a high-probability setup with poor payout asymmetry doesn't clear the bar alone.
Operationally, that means:
- Filtering for defined-risk structures where POP and max loss are both known upfront.
- Pairing POP with expected value so a high win-rate idea can't hide a bad risk-reward ratio.
- Re-running POP after implied volatility shifts before an idea goes out in a briefing.
Traders who want to see this applied to real trade structures can look at the defined-risk trade examples MorningOptions has published.
How Do Multi-Leg Strategies Change the POP Calculation?
Combining legs into butterflies or condors means converting the full payoff into one or more breakeven ranges, then applying the same distribution mapping across each boundary. Where the strategy involves early exercise risk, American-style assignment, or genuinely path-dependent payoffs, analytic models lose accuracy fast. That's when Monte Carlo or binomial modeling earns its keep. Probability of touch answers a different question than POP at expiration: touch tells you if you'll get tested during the trade, POP tells you where you land at the end. Reviewing how options assignment risk actually works clarifies why American-style structures need extra caution here.

An Honest Take on Probability of Profit
Treat POP as a filter for narrowing the field, never as a rule for pulling the trigger. The traders who do best pair it with strict expected-value math and a written management plan, because a probability number without a plan is just a number you'll ignore the moment the trade moves against you.
Get POP-Aware Trade Ideas Before the Market Opens
Running these calculations by hand for every ticker on your watchlist eats up time most retail traders don't have before the opening bell. Morningoptions builds POP-style screening directly into its daily research pipeline, so the filtering happens before you ever see the idea.

Every morning, Morningoptions delivers ranked, specific contract ideas with entry levels, not vague market commentary. The free daily briefing covers a curated set of setups, while the Pro tier at $89/month unlocks the lunchtime scanner and an AI chat tool for researching any ticker on demand.
- Daily pre-market briefings with ranked trade signals scored on probability and expected value together.
- Specific entry levels and bear case analysis included with every idea, not left for you to calculate.
- On-demand ticker research through Signal Lab for traders who want to check their own setups mid-session.
Check today's briefing at Morningoptions and see how POP-aware screening fits into your morning routine before the open.
Frequently Asked Questions About Probability of Profit
Does a 70% probability of profit mean the trade will win 70% of the time? It means the model estimates a 70% chance based on current price, volatility, and time to expiration. It's a snapshot estimate, not a guaranteed win rate, and it changes as market conditions shift.
Why do POP and probability of expiring in the money differ? A call can expire in the money and still lose money if the stock doesn't clear your breakeven, which includes the premium you paid. ITM and profitable aren't the same thing.
Should I only trade high-POP setups? No. High-POP trades often carry small, capped gains against rare but large losses. Pairing POP with expected value and position sizing matters more than chasing probability alone.
Do POP calculators account for commissions? Most don't. Check your specific calculator's assumptions, since commissions and bid-ask spread slippage can meaningfully shift a trade's real breakeven versus the modeled one.
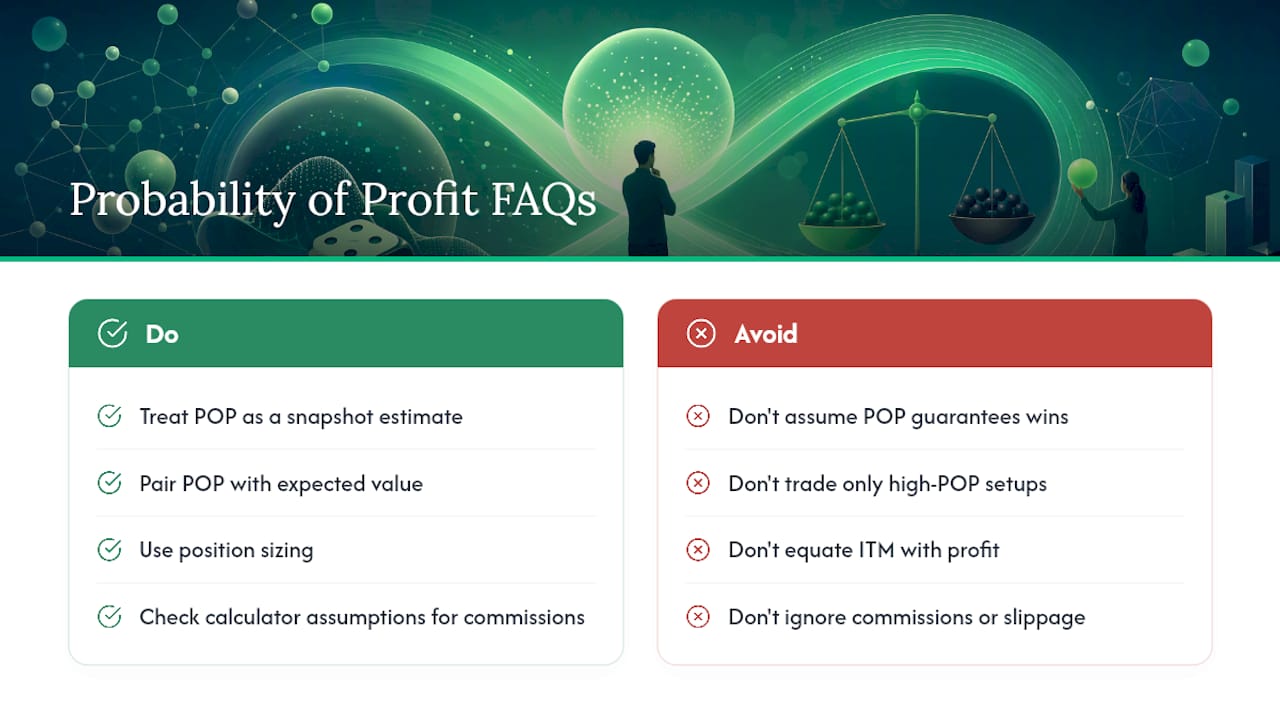
How often should I recalculate POP on an open position? Recheck it after any significant price move or implied volatility shift, particularly around earnings or macro events, since the original number reflects only the moment it was calculated.
Sources
- Options Trading: How to Calculate the Probability of Profit? | QuantInsti Quantra
- tastytrade support — Probability of profit educational note
- Probability of Profit