
A bear market is a sustained drop in market prices, conventionally defined as a decline of 20% or more in a broad index such as the S&P 500, Dow Jones Industrial Average, or Nasdaq Composite from a recent peak. That 20% threshold is a rule of thumb, not a law, but it has become the standard reference point across Wall Street, regulatory guidance, and financial media. When you see it breached, the first moves matter more than the market's next tick.
Your immediate priorities:
- Confirm you have three to six months of living expenses in cash or cash equivalents, separate from your investment accounts
- Check your actual time horizon, not the one you assumed when markets were rising
- Resist the urge to sell everything; panic exits lock in losses and often miss the early recovery
- If you carry margin debt or leveraged positions, review them now, not after another 10% drop
- Consider speaking with a fiduciary advisor; use FINRA BrokerCheck to vet any professional before you pay them
The VIX (CBOE Volatility Index) is a useful real-time gauge of market fear, and the NBER (National Bureau of Economic Research) is the official body that determines U.S. recession dates. Neither replaces the price-decline definition, but both add context you will want when reading headlines.
Key Takeaways
A bear market is a 20% or greater decline in a broad market index, and the most effective investor response combines liquidity protection, time-horizon clarity, and disciplined rebalancing rather than reactive selling.
| Point | Details |
|---|---|
| 20% threshold defines it | A decline of 20% or more in the S&P 500, Dow, or Nasdaq Composite from a recent peak marks a bear market. |
| Causes cluster around a few drivers | Earnings recessions, rising rates, credit stress, and geopolitical shocks are the most common triggers. |
| Duration varies widely | Historical bears have lasted from roughly one month (2020) to over 30 months (1929, 2000–02). |
| Behavior is the biggest risk | Loss aversion and panic selling in Phase 3 cause more lasting damage than the decline itself. |
| Morningoptions for active traders | Daily AI-ranked options briefings with entry levels and bear case analysis help traders act on structure, not emotion. |
Table of Contents
- What is a bear market, and how is it measured?
- What causes a bear market?
- How long do bear markets last, and what do historical examples show?
- Are bear markets and recessions the same thing?
- What should investors do during a bear market?
- Which indicators help you spot a bear market early?
- Options and active-trading tactics for experienced traders in bear markets
- The four phases of a bear market
- Behavioral biases that hurt investors in bear markets
- How bear markets affect bonds, commodities, and real estate
- What Morningoptions watches in a bear market
- Morningoptions gives active traders a daily edge in volatile markets
- Sources
What is a bear market, and how is it measured?
The 20% decline threshold is widely used because it filters out routine corrections (typically 10–19% pullbacks) and signals something more sustained. Investor notes that a bear market typically involves both the price decline and a shift in investor sentiment toward pessimism, which is why a single bad week rarely qualifies.
Which indexes matter most
The S&P 500 is the primary U.S. benchmark for declaring a bear market. It covers 500 large-cap companies and represents a large majority of available U.S. market capitalization, so it reflects broad market health better than any single-sector index. The Dow Jones Industrial Average tracks just 30 blue-chip stocks and can diverge from the S&P 500 during sector-specific selloffs. The Nasdaq Composite skews heavily toward technology, which means it can enter bear territory well before or after the broader market.
Morningstar emphasizes breadth as a key concept: a decline concentrated in a handful of mega-cap names looks different from one where 70% of index members are trading below their 200-day moving averages. Advance-decline lines, which track how many stocks are rising versus falling each day, help confirm whether weakness is narrow or genuinely broad. A bear market where most stocks are falling is a different animal from one driven by a few overweighted names dragging the index down.
Where the VIX fits in
The VIX measures the market's expectation of 30-day S&P 500 volatility, derived from options pricing. A VIX above 30 typically signals elevated fear; readings above 40 have historically corresponded to acute market stress. It is a useful real-time gauge, but it is not a substitute for the percent-decline definition. The VIX can spike and retreat within days, while a bear market requires a sustained move. Think of VIX as the temperature reading and the 20% threshold as the diagnosis.
Practitioners also distinguish between cyclical and secular bear markets. A cyclical bear is shorter and often sentiment-driven, typically lasting months. A secular bear reflects deeper structural problems, such as prolonged earnings stagnation, and can persist for years. The 2000–2009 period, which included two separate bear markets, is often cited as a secular bear phase for U.S. equities.
What causes a bear market?
No two bear markets share exactly the same trigger, but the underlying drivers tend to cluster around a few recurring themes:
- Earnings recessions: When corporate profits fall or growth expectations are sharply revised downward, valuations that looked reasonable suddenly look stretched. The 2000–02 tech bust is the clearest example: dot-com earnings never materialized, and the re-rating was severe.
- Rising interest rates: Higher rates compress equity valuations by increasing the discount rate applied to future earnings and by making bonds more competitive with stocks. The Federal Reserve's aggressive rate hikes in 2022 contributed directly to that year's bear market.
- High inflation: Persistent inflation erodes consumer purchasing power, squeezes corporate margins, and forces central banks to tighten, compounding the pressure on equities.
- Credit stress and financial crises: When credit markets seize, the real economy follows. The 2008 housing collapse and subsequent banking crisis are the textbook cases: mortgage defaults cascaded into bank failures, credit dried up, and the S&P 500 lost more than half its value.
- Geopolitical shocks: Wars, supply-chain disruptions, and energy crises can destabilize markets quickly, particularly when they hit commodity prices or global trade flows.
- Policy mistakes: Central bank missteps, fiscal policy reversals, or regulatory shocks can accelerate declines that might otherwise have been contained.
The interaction between fundamentals and sentiment is what makes bears self-reinforcing. An initial shock, say a surprise inflation reading, triggers selling. That selling generates negative headlines. Negative headlines shift retail investor sentiment. Sentiment shifts drive more selling. Investopedia notes that experienced insiders often treat sustained, broad-based pessimism as a more reliable bear signal than any fixed percentage, precisely because this feedback loop is what separates a true bear from a sharp but temporary correction.
How long do bear markets last, and what do historical examples show?
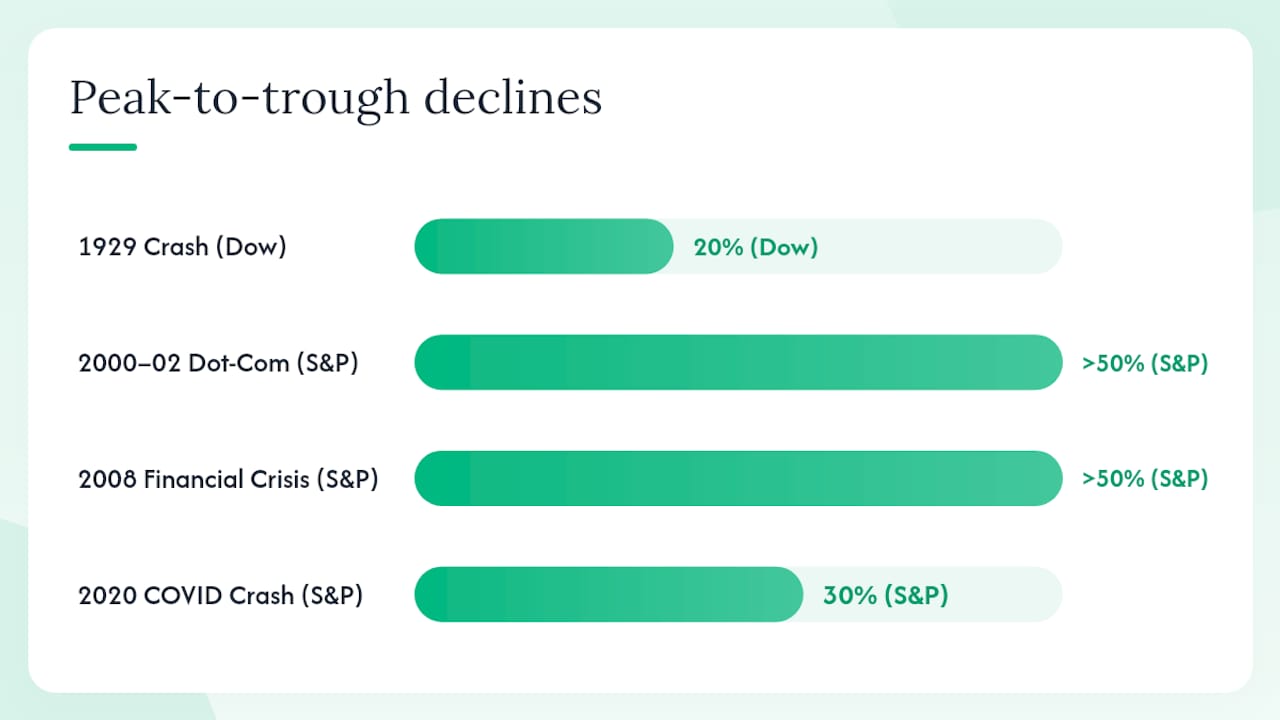
Bear markets vary enormously in length and severity. Some are sharp and brief; others grind lower for years. The table below draws on widely cited historical data for four major U.S. bear markets.
| Event | Approximate cause | Peak-to-trough decline | Approximate duration |
|---|---|---|---|
| 1929 Crash / Great Depression | Credit excess, bank failures, policy errors | 20% (Dow) | months |
| 2000–02 Dot-Com Bust | Earnings re-rating, tech overvaluation | more than half (S&P 500) | ~30 months |
| 2008 Financial Crisis | Housing collapse, credit crisis | more than half (S&P 500) | months |
| 2020 COVID Crash | Pandemic shock, economic shutdown | 30% (S&P 500) | ~1 month (trough) |
The 2020 bear is the outlier: the fastest 30%-plus decline in U.S. market history, followed by an equally rapid recovery driven by massive fiscal and monetary stimulus. The 1929 episode sits at the other extreme, with a recovery that took more than two decades for the Dow to reclaim its prior high in nominal terms.
Wikipedia's market trend entry provides useful taxonomy here: primary trends (lasting one to several years) versus secondary reactions (shorter countertrend moves within a primary trend). Most bear markets are primary downtrends, but within them you will see sharp bear-market rallies that can easily be mistaken for recoveries.
The key takeaway from history is not the average length but the variance. Planning for a bear to last "about 14 months" because that is a commonly cited average is a mistake. Some end in weeks; some last years. What history does confirm is that U.S. markets have recovered from every bear market on record, though the timeline has ranged from months to decades depending on the depth of the underlying economic damage.
Are bear markets and recessions the same thing?
They are related but distinct, and conflating them leads to bad decisions. A bear market is a market price event: a 20% decline in a broad index. A recession is an economic event: a significant decline in economic output, officially determined in the U.S. by the NBER after reviewing GDP, employment, income, and other data.
Markets are forward-looking. They often decline months before a recession is officially declared, because investors are pricing in expected economic weakness. The S&P 500 typically peaks before the NBER's recession start date and often bottoms before the recession officially ends. In 2020, the NBER declared a recession that began in February, but the market had already bottomed in March and was recovering by April.
Not every bear market comes with a recession. The 1987 crash saw the Dow fall roughly 22% in a single day, yet no recession followed. Conversely, not every recession triggers a bear market immediately. The relationship is real but not mechanical, which is why watching only one of these signals gives you an incomplete picture.
What should investors do during a bear market?
The single most damaging move most investors make in a bear market is selling at or near the bottom, then waiting too long to re-enter. Here is a prioritized action framework.
Do these things:
- Secure your emergency cash first. If your living expenses depend on your portfolio, you are not positioned to ride out a prolonged decline.
- Confirm your real time horizon. A 45-year-old with a 20-year investment runway is in a fundamentally different position than someone retiring in 18 months.
- Rebalance systematically, not emotionally. If equities have fallen and bonds have held, rebalancing back to your target allocation means buying equities at lower prices, which is the opposite of panic selling.
- Consider phased buying. Dollar-cost averaging into a falling market removes the pressure of timing a bottom, which Investopedia notes is effectively impossible for most investors.
- Review tax-loss harvesting windows. Realized losses can offset capital gains elsewhere in your portfolio. Options strategies with tax efficiency can also factor into this calculus for active traders.
- Check your brokerage account protections. SIPC covers up to $500,000 in securities and cash per account in the event of brokerage failure, not market losses. Knowing what is and is not covered matters.
Avoid these:
- Blanket selling driven by headlines rather than your plan
- Attempting to time the exact bottom
- Adding margin or leverage to "average down" without a defined exit
- Ignoring concentration risk in a single sector or stock
If you are considering professional help, verify any advisor's background through FINRA BrokerCheck and review their SEC Form CRS disclosures before engaging. These filings confirm an advisor's services, fees, and fiduciary status.
Pro Tip: Premarket trading during bear markets can be especially volatile and misleading. Futures gaps overnight often reverse by the open. Read about premarket dynamics before acting on after-hours price moves.
Which indicators help you spot a bear market early?
No single indicator calls a bear market reliably. What you want is convergence across multiple signals.
- Percent decline from peak (20% rule): The primary definition. Watch the S&P 500 closing levels relative to the most recent all-time high.
- Advance-decline line: When more stocks are declining than advancing over weeks, not just days, breadth is deteriorating. A narrow market where only a few names are holding up is fragile.
- VIX spikes: Sustained VIX readings above 25–30 signal elevated fear. A single spike can be noise; a VIX that stays elevated for weeks is a different signal.
- Credit spreads: The gap between corporate bond yields and Treasury yields widens when investors demand more compensation for default risk. Widening high-yield spreads often precede or accompany equity declines.
- Yield curve signals: An inverted yield curve (short-term rates above long-term rates) has preceded most U.S. recessions. It is a leading indicator, not a timing tool.
- Sector rotation: Money tends to rotate from growth and cyclical sectors into defensives (utilities, consumer staples, healthcare) as sentiment deteriorates. Sector analysis can help you read these shifts early.
False positives are common. A single bad week in the S&P 500 with a VIX spike and a widening spread can look alarming and resolve quickly. The signal becomes meaningful when multiple indicators align and persist. Context matters: a VIX spike during a geopolitical headline is different from one accompanied by deteriorating earnings guidance across multiple sectors.
Options and active-trading tactics for experienced traders in bear markets
This section is intended for experienced options traders who understand defined-risk structures and are comfortable with derivatives. It is not a recommendation to begin trading options without prior knowledge.
Bear markets change the options landscape in specific ways. Implied volatility rises as uncertainty increases, which makes buying options more expensive and selling them more attractive from a premium standpoint. Understanding this dynamic is the starting point for any bear-market options strategy.
- Buying protective puts: A put option gives you the right to sell shares at a set price, providing downside protection on existing positions. The cost is the premium, which rises with implied volatility, so buying puts after a large VIX spike is expensive. Buying them before or early in a decline is more cost-effective.
- Collar strategies: Combine a protective put with a covered call to reduce the net cost of protection. You cap your upside but limit your downside, which suits investors who want to stay invested without full exposure.
- Vertical put spreads: Buying a put and selling a lower-strike put limits both your risk and your cost. This defined-risk structure suits traders who expect a continued decline but want to cap their maximum loss. See defined-risk trade examples for concrete setups.
- Selling covered calls: If you hold stock that has declined, selling calls against it generates income and slightly reduces your cost basis. It does not protect against further declines but improves the position's economics.
- Calendar and diagonal spreads: These exploit the difference in implied volatility between near-term and longer-dated options. In high-volatility environments, near-term options are often richly priced relative to longer-dated ones.
Risk controls that are non-negotiable in a bear market:
- Size positions so that the maximum defined loss on any single trade is a small fraction of total capital
- Use spreads rather than naked short options; unlimited-risk structures in a falling market can produce catastrophic losses
- Predefine your adjustment or exit rules before entering, not after the position moves against you
- Review options strategies for volatile markets for a fuller treatment of strategy selection by market condition
Pro Tip: Morningoptions' daily briefings include bear case analysis and specific contract ideas with entry levels for each trade idea, which is exactly the kind of pre-defined framework that helps active traders avoid improvising in real time.
The four phases of a bear market
Recognizing where you are in a bear market is as useful as knowing you are in one. Most bear markets move through recognizable stages, though the timing and severity of each varies.
Phase 1: Distribution. Smart money begins selling into strength. Prices may still be near highs, but volume patterns shift and breadth starts deteriorating quietly. Most retail investors do not notice.
Phase 2: Initial decline. The index breaks below key support levels. Headlines turn negative. The 20% threshold may be breached here, officially confirming the bear. Sentiment shifts from complacency to concern.
Phase 3: Panic selling. This is the most emotionally intense phase. Forced selling by leveraged investors, margin calls, and fund redemptions accelerate the decline. VIX spikes. Volume surges. This phase often produces the steepest single-day drops and the most dramatic bear-market rallies, which can easily be mistaken for the recovery.
Phase 4: Stabilization and base-building. Selling pressure exhausts itself. Prices stop making new lows even on bad news. Breadth begins improving. This phase can last weeks or months before a confirmed uptrend resumes. The temptation to call the bottom too early is strongest here.
Most investors who sell in Phase 3 miss the recovery that begins in Phase 4. The panic phase feels like the decline will never end, which is precisely why it is the worst time to make permanent portfolio decisions.
Behavioral biases that hurt investors in bear markets
The financial loss is only part of the problem. The psychological response to that loss is often what causes the lasting damage.
Loss aversion is the most documented bias in bear markets. Losses feel roughly twice as painful as equivalent gains feel good, which means a 20% decline creates disproportionate emotional pressure to act, even when acting is the wrong move.
Recency bias leads investors to extrapolate recent declines indefinitely. After three months of falling prices, the brain treats "markets fall" as the new normal, making it harder to hold or add to positions even when valuations have improved significantly.
Herding amplifies both phases: investors buy because others are buying in bull markets, then sell because others are selling in bears. Institutional flows, social media sentiment, and financial media all reinforce this.
Anchoring to a prior portfolio high creates a psychological loss that does not exist in economic terms. An investor who anchors to their peak portfolio value will feel perpetually behind, even after a strong recovery, if the anchor never resets.
Managing these biases requires structure, not willpower. A written investment policy statement that defines your rebalancing rules, your time horizon, and your acceptable drawdown range before a bear market starts is far more effective than trying to reason your way through panic in real time. Reviewing your plan rather than your portfolio balance during acute declines is a practical first step.
How bear markets affect bonds, commodities, and real estate
Equities get the headlines, but bear markets ripple across asset classes in ways that matter for portfolio construction.
Bonds have historically served as a partial hedge during equity bear markets, as investors rotate into Treasuries for safety, pushing yields down and prices up. The 2022 bear market broke this pattern: rising inflation forced the Fed to raise rates aggressively, which crushed both stocks and bonds simultaneously. That episode reminded investors that the equity-bond correlation is not fixed.
Commodities behave differently depending on the bear's cause. A demand-driven recession typically pulls commodity prices lower alongside equities, as in 2008. A supply-shock bear, like the 1970s oil crisis, can see commodities rise while equities fall. Gold often holds value or appreciates during periods of acute financial stress, though it is not a reliable equity hedge in every environment.
Real estate tends to lag equity markets in both declines and recoveries because it is illiquid and transactions take time. The 2008 bear market was unusual in that the housing collapse caused the equity bear, reversing the typical sequence. REITs (real estate investment trusts), which trade like stocks, often decline in line with equities during bear markets and recover faster than physical real estate.
The practical implication: diversification across asset classes reduces volatility but does not eliminate it. In severe bears, correlations across asset classes tend to rise, meaning diversification provides less protection exactly when you want it most.
What Morningoptions watches in a bear market
Bear markets are where pre-market intelligence separates disciplined traders from reactive ones. Before the open each morning, the signals that matter most are not the overnight futures level but the options order flow, the implied volatility term structure, and which sectors are seeing unusual put activity.
The Morningoptions team monitors VIX behavior relative to realized volatility, because when implied volatility is running significantly above realized, options premium is elevated and strategy selection shifts accordingly. Sector leadership rotation is tracked daily: when defensive sectors consistently outperform growth names on up days, the underlying trend is still bearish regardless of what the index does on any given session. Pre-market earnings catalysts and macro data releases are flagged in each morning's briefing because they set the tone for the day's options pricing before most retail traders have had their first coffee.
The watchlist items that matter most in a bear environment:
- VIX term structure (contango vs. backwardation signals near-term fear levels)
- Put-to-call ratios on major ETFs (SPY, QQQ) as a sentiment gauge
- Credit spread movement overnight
- Sector ETF relative strength versus the S&P 500
These are not signals to trade mechanically. They are context that helps active options traders select the right strategy for the day's conditions, whether that means a defined-risk bearish spread, a volatility play, or simply staying flat.
Morningoptions gives active traders a daily edge in volatile markets
Bear markets reward preparation. Morningoptions delivers AI-powered options briefings every market morning, each one ranked and specific: contract names, entry levels, bear case analysis, and the strategy rationale, not vague market commentary.

The Pro tier ($89/mo) adds the lunchtime scanner and Signal Lab, an AI chat tool for researching specific tickers on demand. When the market is moving fast and you need to evaluate a setup quickly, Signal Lab gives you a structured, AI-vetted read in seconds rather than hours of manual research. Free daily briefings are available to get started.
Active options traders who want a clear, fast read on the day's setups before the open can start with Morningoptions today.
Sources
- Bear Markets: The business cycle explained — Fidelity
- Bear market — Investopedia
- Investor
- Bear Market — Morningstar
- Market trend — Wikipedia
- SIPC
- BrokerCheck — FINRA