
A trading edge is a positive mathematical expectancy that persists across a large sample of trades. Not a feeling. Not a good month. Not a strategy that "looks right" on a chart. Specifically, it means your profit factor exceeds 1.2 net of costs across a large sample of trades on a stable strategy. Below that threshold, you are not trading with an edge. You are gambling with extra steps.
The math is straightforward. Your edge exists when:
- Win rate × average win exceeds loss rate × average loss across enough trades
- Your profit factor (gross profit divided by gross loss) stays above 1.2 over a sample of at least 100–200 trades
- Your reward-to-risk ratio holds consistently, not just on cherry-picked setups
- Your sample size reaches a sufficiently large number of trades before you draw any firm conclusions
With too few trades, variance dominates everything. A strategy with zero real edge can produce a winning streak long enough to feel like proof. The law of large numbers only works in your favor once the sample is large enough to normalize that noise.
Why a trading edge separates traders from gamblers
Without a measurable edge, every trade is a coin flip weighted slightly against you by commissions and spread. You might win for a week, a month, even a quarter. But the math catches up. A sustainable edge requires superior risk management, disciplined execution, and a specific quantifiable market behavior you can exploit repeatedly.

The casino analogy holds up well here. A roulette wheel's green zero gives the house a small but persistent statistical advantage. Over millions of spins, that tiny edge compounds into enormous profits. Your trading edge works the same way: it does not need to be large, just consistent and positive across enough trades to matter.

An edge also tells you how to allocate capital. If your expectancy is +$10 per trade, you need far more volume to hit income targets than if it is +$80. Understanding that number shapes your trade frequency, position sizing, and how aggressively you pursue setups. Traders who skip this math often overtrade weak setups or undertrade strong ones.
Risk management is not separate from your edge. It is part of it. A positive expectancy strategy can still blow up an account if position sizing is reckless during a drawdown. Protecting capital through losing streaks is what lets the edge play out over time.
What does a real trading edge look like in practice?
Trading edges fall into three primary categories: analytical, informational, and technological. Most retail traders operate in the analytical category, and that is perfectly viable.
- Analytical edge: Exploiting historical price inefficiencies through quantitative analysis. Example: a specific VWAP bounce entry that produces a strong profit factor over many logged trades. That is an edge. "I'm good at reading price action" is not.
- Informational edge: Unique or early access to market data. Legally, this means alternative data sources like satellite imagery, web traffic signals, or credit card transaction flows processed before the consensus forms.
- Technological edge: Superior execution speed or algorithmic advantages. Mostly the domain of institutional players and high-frequency firms, not retail traders.
- Behavioral edge: The most accessible advantage for retail traders. Avoiding emotional pitfalls like panic selling, revenge trading, and FOMO-driven entries preserves capital that less disciplined participants give away. This is not a soft skill. It is a structural advantage that compounds over time.
Behavioral edges tend to be the most durable because they are rooted in human psychology, not market structure. Momentum anomalies, post-earnings drift, and mean reversion after sharp selloffs all have behavioral roots that do not disappear when a few more traders discover them.
Pro Tip: Your edge probably already exists somewhere in your trade data if you have been trading for more than a few months. You just have not extracted it yet. Start by filtering your journal by setup type, time of day, and market condition.
How to develop and validate your trading edge
This is a nine-step process. Skip steps and you end up with a backtest that flatters you and a live account that does not.
-
Educate yourself on market behavior. Understand what drives price in your chosen market: earnings, macro data, options flow, liquidity conditions. You cannot form a valid hypothesis without knowing the mechanism behind price movement. Reading about market condition classifications gives you the vocabulary to describe when your setup applies.
-
Formulate a testable hypothesis. Write it in two parts: the claim (what price behavior you expect) and the mechanism (why it should exist). Example: "After strong earnings surprises, price drifts upward over the next 5–15 trading days because analyst revisions and institutional rebalancing lag the initial reaction." Both parts must be written before you look at data. A trading thesis forces this discipline.
-
Backtest on in-sample data. Define a specific historical date range and test only on that range. Measure edge frequency, average gain per instance, and drawdown behavior. If the hypothesis fails in-sample, stop. Do not adjust parameters to make it work.
-
Validate on out-of-sample data. Reserve a completely separate date range untouched during hypothesis formation. Run the same strategy with the same parameters on this unseen data. Out-of-sample validation over a period of time minimizes overfitting and confirms robustness before you risk real capital.
-
Journal every trade with full detail. Record setup type, entry and exit prices, market conditions, time of day, and outcome. Filtering trade data by setup and conditions is how edge patterns surface. Without this data, you are guessing.
-
Calculate your three core metrics. Win rate, reward-to-risk ratio, and profit factor. Run these across your full sample, then filter by setup type. A profit factor above 1.2 over a sample of at least 100–200 trades indicates a functional edge. Below 1.0 means you are losing money systematically, regardless of how the individual trades felt. Tracking these metrics systematically is covered in depth in this guide to options trade tracking.
-
Refine through iteration. Markets shift. A setup that worked cleanly in a trending environment may underperform in choppy conditions. Document the conditions where your edge works and where it fails, then adjust parameters and retest. This is not a one-time project.
-
Apply strict risk management. Position sizing and stop-loss discipline are not optional add-ons. They determine whether your positive expectancy actually translates to account growth or gets wiped out by a single oversized loss. A solid framework for this is risk management in trading.
-
Build and protect your mental discipline. Emotional consistency is what lets the edge play out. A trader who abandons their rules during a drawdown is not actually trading their edge. They are trading their feelings, which have no positive expectancy.
Pro Tip: The backtest trap is real. A strategy that only works with a lookback window of exactly 23 periods and an entry threshold of exactly 0.74 is almost certainly overfit to noise. Real signal holds up across a reasonable range of parameter values.
Expect this entire process to take a considerable amount of time before you have enough data to draw reliable conclusions. Patience is not a virtue here. It is a statistical requirement.
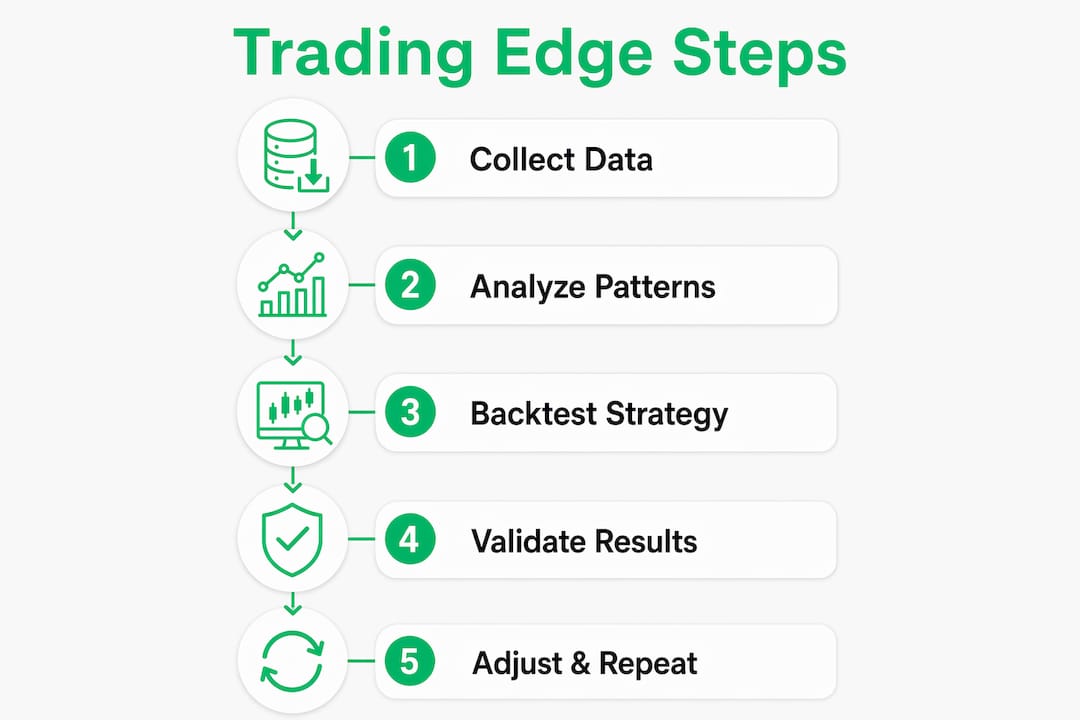
Your edge will erode. Here is what to do about it.
Trading edges erode over time as more participants identify and exploit similar setups. This is not a reason to abandon edge-based trading. It is a reason to treat your edge as a living process rather than a discovered secret.
The traders who sustain their advantage long-term do a few specific things. They keep detailed records of when their edge works and when it stops working. They set explicit falsification conditions before performance softens, so they can distinguish a dead edge from a temporary drawdown. And they continuously cross-verify signals rather than relying on a single setup in isolation.
Behavioral discipline tends to produce the most durable retail edge precisely because it is not a pattern that gets arbitraged away. Cognitive biases in market participants do not disappear when a few traders learn to avoid them. The supply of emotional mistakes is essentially unlimited. Finding a trading approach that fits your psychology is therefore as important as finding one that fits the data.
The goal is not to find one perfect setup and ride it forever. The goal is to build a process that keeps generating testable hypotheses, validates them rigorously, and retires them cleanly when the data says they have stopped working.
Key Takeaways
A trading edge is a positive mathematical expectancy verified across a sufficiently large sample of trades, defined by three metrics: win rate, reward-to-risk ratio, and profit factor above 1.2.
| Point | Details |
|---|---|
| Edge requires positive expectancy | Win rate × average win must exceed loss rate × average loss across a large trade sample. |
| Profit factor is the core metric | A profit factor above 1.2 over 100–200 trades indicates a functional edge; below 1.0 means net losses. |
| Sample size determines validity | At least 100–200 trades are needed to separate skill from variance and confirm a real edge. |
| Behavioral edge is most durable | Avoiding emotional mistakes like panic selling and FOMO gives retail traders a persistent structural advantage. |
| Edges erode and require refinement | Document when your edge works and fails, and continuously retest as market conditions change. |
Put your edge to work every morning

Knowing your edge is step one. Applying it to specific, ranked trade ideas before the market opens is where it pays off. Morningoptions delivers AI-powered options briefings every market morning, with specific contract ideas, entry levels, and setup context, not vague commentary. The free daily briefing covers the top setups. The Pro tier at $89/month adds a lunchtime scanner and an on-demand AI chat scanner for researching any ticker in real time. If you are building or refining your edge in options, it is worth seeing what a structured, data-vetted morning read looks like.