
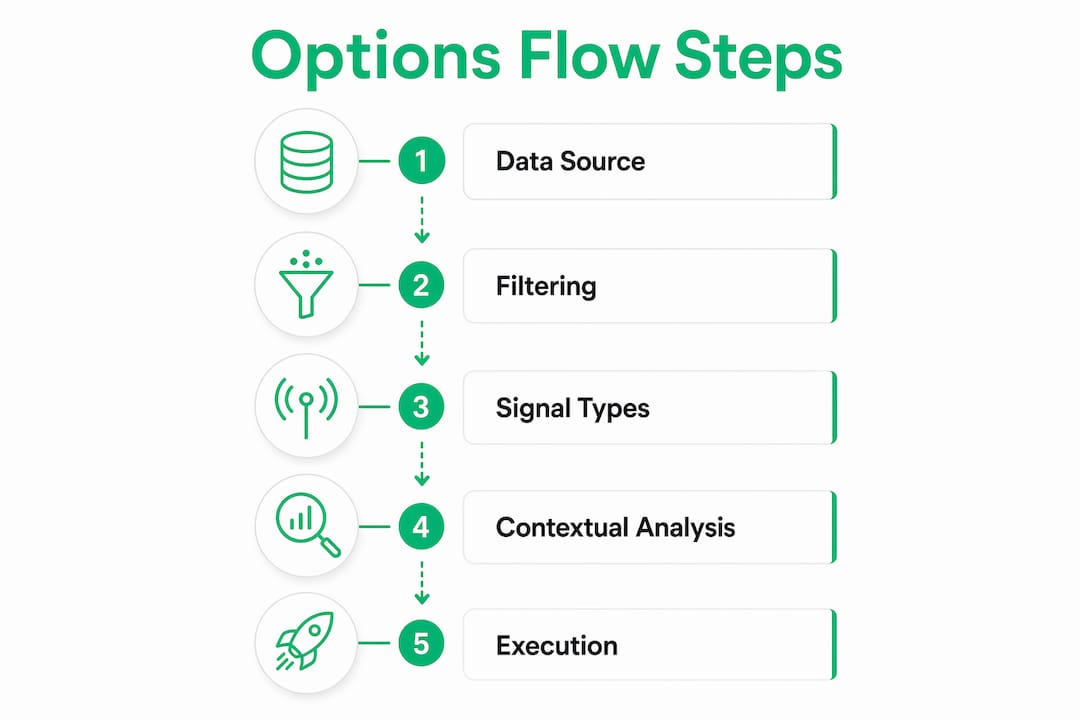
Options flow analysis is the real-time reading of large options trades — size, aggression, premium, Vol/OI ratio, and execution type — to infer how institutional players are positioning and how urgently they're acting. The practical takeaway: treat flow as a confirming evidence layer, not a standalone signal. The highest-edge setups combine accumulation of prints on the same strike and expiry, fresh Vol/OI spikes, and aggressive fills (sweeps or at-ask executions) near a known catalyst. Three anchors to keep in mind from the start: data originates from OPRA and exchange trade prints, Vol/OI tells you whether money is new or recycled, and the first 30 minutes of the session consistently carries the most actionable institutional flow.
Table of Contents
- What is options flow analysis, and where does the data come from?
- Which signals actually matter — sweeps, blocks, and aggression explained
- How to interpret flow in context — price action, IV, earnings, and timing
- What flow does not tell you — limitations and common pitfalls
- Which tools do U.S. traders use for live options flow?
- How to read an options flow print — a step-by-step walkthrough
- Practitioner checklist: rules pro traders follow when using flow
- Key Takeaways
- Why flow is a tool, not a crystal ball
- Morningoptions: vetted flow ideas delivered every morning
- Useful sources and further reading
What is options flow analysis, and where does the data come from?
Every options trade executed on a U.S. exchange generates a print. Those prints route through OPRA — the Options Price Reporting Authority — which consolidates and disseminates quote and trade data from all 17 U.S. options exchanges in real time. Flow scanners tap into this consolidated feed (or direct exchange feeds) and parse each print into structured fields a trader can actually read.
Options flow adds directional context that raw volume alone cannot provide. Volume tells you how many contracts changed hands; flow tells you who was aggressive, how much premium moved, and how the order was executed. That distinction is what makes flow useful for inferring intent.
"Options flow is the real-time tape of large orders showing size, direction, urgency, and premium — it adds directional context that volume alone does not provide." — TradeAlgo
Large institutional orders that cannot be filled on a single exchange without moving the market often route as block trades, negotiated off-exchange and reported separately under block trade reporting conventions. Smaller but still significant orders may split across multiple exchanges in rapid succession — those are sweeps, and their multi-exchange routing is a fingerprint of urgency.
Here are the core fields you'll see on any serious flow scanner:
| Field | What it shows | Trader interpretation |
|---|---|---|
| Ticker / Strike / Expiry | Contract identity | Identifies the underlying and time horizon |
| Side (Buy / Sell) | Direction of the aggressor | Buyer-initiated vs. seller-initiated |
| Aggression | At-ask, at-bid, mid | Urgency of the fill |
| Premium | Total dollar value of the print | Filters institutional from retail noise |
| Contracts | Number of contracts | Confirms size context |
| Vol/OI | Volume ÷ open interest | New money vs. rolls or closes |
| Execution code | Sweep, block, cross, split | Order routing method and urgency |
| DTE | Days to expiration | Time-sensitivity of the bet |
Scanners apply filters on top of this raw feed. A premium threshold — commonly $100K–$500K minimum — cuts out retail noise and focuses the tape on institutional-sized prints. Vol/OI filters, closing-position detection, and spread-leg identification further refine what surfaces. Without those filters, the raw tape is overwhelming and mostly useless.
Which signals actually matter — sweeps, blocks, and aggression explained
Not every large print deserves your attention. Understanding the signal hierarchy is what separates traders who use flow well from those who chase noise.
Sweeps vs. blocks vs. splits
A sweep is a multi-exchange fill executed simultaneously across several venues to get a large order done fast. Sweeps signal urgency — the buyer or seller did not want to wait for a single venue to fill the full size. Multi-exchange routing has grown significantly since 2020, making sweep detection one of the most important lenses on institutional intent. A block is a large single fill, often negotiated off-exchange between two counterparties. Blocks can signal planning and conviction, but they're less time-sensitive than sweeps. A split is a single large order broken into smaller sequential prints on one exchange — institutions use splits to mask size, which is exactly why accumulation detection matters.

Aggression: the directional tell
Fills at or above the ask indicate buyer aggression — someone paid up to get filled immediately. Fills at or below the bid indicate seller aggression. Mid-fills are ambiguous and generally less actionable. When a sweep hits at the ask, you have two urgency signals stacked: multi-exchange routing and willingness to pay the spread. That combination is meaningful.
Put vs. call flow and strike moneyness
Call flow is not automatically bullish, and put flow is not automatically bearish. Deep in-the-money (ITM) puts bought in size often reflect hedging on an existing long position, not a directional short bet. Out-of-the-money (OTM) calls swept at the ask with short DTE, on a stock with a catalyst approaching, read very differently. Strike moneyness matters:
- OTM sweeps at-ask + short DTE: high-conviction directional bets, time-sensitive
- ITM large blocks: often hedges, delta-driven, or spread legs — lower directional signal
- ATM prints with high Vol/OI: fresh positioning, worth tracking for accumulation
Signal priority: what earns Grade A status
Prioritize prints that check multiple boxes simultaneously:
- Large premium ($250K+) at or above the ask
- Sweep execution (multi-exchange)
- Vol/OI ratio of 5x–20x or higher, confirming fresh money
- Short DTE (under 14 days), suggesting imminent catalyst awareness
- Accumulation: the same strike and expiry hit repeatedly within a session
A single large print with only one of these attributes is a yellow flag, not a green light. Short-dated options account for a substantial share of equity options volume, and many of those prints are routine — the combination of attributes is what elevates a print from noise to signal.
How to interpret flow in context — price action, IV, earnings, and timing
Flow prints do not exist in a vacuum. A $500K call sweep on a stock trading at resistance, with implied volatility already elevated heading into earnings, reads completely differently than the same print on a quiet day with no catalyst on the calendar.
The context checklist
Before acting on any print, run through these four checks:
- Price action: Is the stock near support (for calls) or resistance (for puts)? Flow against the technical trend is a red flag.
- Implied volatility: Is IV expanding or contracting? A call sweep into rising IV may be a volatility bet, not a directional one.
- Catalyst calendar: Earnings, FDA decisions, and macro events (Fed meetings, CPI prints) attract hedging and speculative flow. Know what's on the calendar before interpreting any print.
- Existing trend: Flow that confirms the prevailing trend is more reliable than flow that fights it.
Dealer hedging: the biggest source of false positives
When a market maker sells calls to an institution, they hedge by buying the underlying stock. That hedging activity shows up in the options tape as large prints — but the market maker is not making a directional bet. Markers that suggest dealer hedging rather than directional positioning: heavy ITM prints with high delta, spread legs (a call and put on the same underlying printed close together), and prints that appear during index rebalancing windows. Common false positives include market-maker hedging, index rebalancing, dividend adjustments, and closing trades — all of which produce large prints that look institutional but carry no directional signal.

Timing: why the first 30 minutes is different
Institutional flow concentrates early — the first 30 minutes after the open is when overnight-researched strategies execute. Desks that spent the previous evening building a thesis act at the open, which is why the 9:30–10:00 AM window consistently produces the highest-quality flow. Late-day prints (after 3:00 PM) skew toward position closes, hedges ahead of overnight risk, and end-of-day rebalancing. They're not worthless, but they require more skepticism.
Pro Tip: Prioritize clusters over single prints. If the same strike and expiry gets hit three or four times across a session, that accumulation pattern carries far more conviction than one large isolated sweep. Check next-day OI changes to confirm whether the prints opened new positions.
What flow does not tell you — limitations and common pitfalls
Flow is a raw record of activity, not a guaranteed signal. A large premium trade is rarely actionable in isolation — context makes the difference, and even with context, a substantial share of unusual options activity does not lead to profitable directional moves.
The most common misreads
- Over-interpreting single prints: one large sweep, no accumulation, no catalyst — this is noise more often than not.
- Ignoring Vol/OI: a $1M premium print on a contract with 50,000 existing open interest is far less significant than the same premium on a contract with 200 OI. Fresh money is the signal; recycled money is not.
- Misreading spread legs: a large call print paired with a large put print on the same underlying is almost certainly a spread or collar, not two separate directional bets.
- Confusing hedges with directional bets: deep ITM prints, especially in index options, are frequently institutional hedges. Index options in particular are dominated by portfolio-level hedging and rebalancing flows that have nothing to do with a directional view on the index.
- Chasing prints without chart confirmation: flow that contradicts the chart structure has a poor track record. The tape and the chart need to agree.
Noise sources to know
Order-splitting is a deliberate tactic — institutions break large orders into smaller sequential prints to avoid moving the market. What looks like accumulation can sometimes be a single institution filling one position across time. Dividend-related activity and corporate actions (buybacks, conversions) also generate large prints that are purely mechanical. Experienced flow traders set premium floors and Vol/OI minimums precisely to filter out these mechanical prints before they waste attention.
Practical defensive rules
Apply at least three of these before treating a print as actionable:
- Minimum premium: $100K floor (retail), $250K+ for higher conviction
- Vol/OI minimum: at least 3x, preferably 5x or higher
- Require accumulation: two or more prints on the same strike/expiry
- Avoid index options for directional reads
- Confirm with price action before sizing a position
Which tools do U.S. traders use for live options flow?
The market for flow tools ranges from free raw tape viewers to paid scanners with multi-layer filtering and grading. Knowing what each type delivers helps you match the tool to your workflow.
Tool types
- Raw tape viewers: show every print above a size threshold with minimal filtering. High noise, but useful for traders who want to build their own filters.
- Curated scanners: apply premium floors, Vol/OI checks, spread detection, and closing-position filters before surfacing prints. Most retail traders benefit from this layer.
- Heatmaps and cumulative flow charts: aggregate call vs. put premium over the session to show net directional bias by ticker or sector.
- Historical flow databases: allow backtesting of flow signals against subsequent price moves — useful for validating your own filter criteria.
Features that matter for an active retail workflow
- Real-time sweep and block detection with execution codes
- Vol/OI calculation displayed per print
- DTE filter (ability to isolate short-dated prints)
- Premium threshold filter
- Accumulation badges or repeat-print flagging
- Chart integration or at least a link-out to a charting platform
Platform examples
TradesViz offers a flow analysis glossary and tracking tools that help traders log and review flow signals alongside their own trade outcomes — particularly useful for building a personal performance model over time. InsiderFinance provides a live flow feed at InsiderFinance Flow with filtering for unusual activity, sweep detection, and sentiment scoring. Both are examples of the curated-scanner category; neither is a substitute for your own contextual judgment.
| Tool type | Best for | Key limitation |
|---|---|---|
| Raw tape viewer | Traders building custom filters | High noise, requires experience |
| Curated scanner | Active retail traders | Filter logic is a black box |
| Heatmap / cumulative flow | Session-level sentiment reads | Loses print-level detail |
| Historical flow database | Backtesting filter criteria | Latency; data costs |
Latency matters. Most retail-grade scanners deliver flow with a 1–5 second delay from the exchange print. That's workable for swing setups but can be a disadvantage for very short-term day trades where the first fill on a sweep is the signal. Subscription costs for curated scanners typically run $50–$200/month for retail-grade tools; institutional-grade feeds are significantly more expensive. A paid scanner is justified when you're trading flow signals regularly enough that the filter quality saves you from bad trades — not before.
How to read an options flow print — a step-by-step walkthrough
Here's a reproducible sequence you can apply to any print on any scanner. Run through it in order before deciding whether a print deserves further attention.
The reading sequence
- Note the ticker, strike, and expiry. What's the underlying? Is the expiry short-dated (under 14 days) or longer-term? Short DTE prints near a catalyst carry more urgency.
- Check aggression. Was the fill at-ask (buyer aggressive), at-bid (seller aggressive), or mid (ambiguous)? At-ask sweeps are the highest-conviction signal.
- Calculate premium and notional. Premium = contracts × 100 × option price. A 500-contract fill at $2.00 = $100,000 in premium. Does this clear your minimum threshold?
- Compute Vol/OI. Divide today's volume on that contract by yesterday's open interest. A ratio of 5x or higher suggests fresh positioning; below 1x suggests a roll or close.
- Check DTE and IV. Short DTE + elevated IV heading into a catalyst = high time-sensitivity. Long DTE + low IV = potentially a longer-term hedge or speculative position.
- Verify accumulation and context. Has this strike/expiry been hit before today? Does the print align with the chart (support for calls, resistance for puts)? Is there a catalyst on the calendar?
Annotated example (hypothetical print)
Suppose your scanner surfaces this: XYZ Corp, $150 call, expiring in 9 days, 800 contracts, at-ask sweep, $3.20 premium per contract, Vol/OI = 12x, total premium $256,000.
| Step | Reading | Decision |
|---|---|---|
| Ticker / Strike / Expiry | XYZ $150C, 9 DTE | Short-dated, near-term catalyst window |
| Aggression | At-ask sweep | Buyer paid up; multi-exchange urgency |
| Premium | $256,000 | Clears $100K floor; institutional-sized |
| Vol/OI | 12x | Strong evidence of fresh new money |
| DTE / IV | 9 days; IV rising | Catalyst-aware positioning |
| Accumulation / Context | Second hit on same strike today; stock near breakout | Accumulation confirmed; chart agrees |
This print checks every box. It earns further investigation — a chart review, a catalyst check, and a position-size decision. It does not automatically mean you buy the same call. It means the print is worth your attention.
Quick triage checklist
- Premium above your floor? (Yes / No)
- At-ask or sweep execution? (Yes / No)
- Vol/OI above 3x? (Yes / No)
- Accumulation on this strike today? (Yes / No)
- Chart and catalyst aligned? (Yes / No)
Three or more "Yes" answers: investigate further. Fewer than three: move on.
Practitioner checklist: rules pro traders follow when using flow
The difference between traders who profit from flow and those who lose money chasing it usually comes down to discipline around filters and workflow, not access to better data.
Signal grading rules
- Set a hard premium floor before the session starts. Don't lower it mid-day because a print looks interesting.
- Require Vol/OI of at least 3x; prefer 5x+ for high-conviction setups.
- Restrict DTE to under 30 days for directional reads; longer DTE prints are more likely to be hedges or LEAPS strategies.
- Avoid index options (SPY, QQQ, IWM) for directional flow reads — too much hedging and rebalancing noise.
- Require at least two prints on the same strike/expiry before treating it as accumulation. Single prints are noisy; repeated aggressive prints on the same contract are the strongest directional signal in flow.
- Grade the signal before sizing. A Grade A print (all boxes checked) warrants a full position; a Grade B print (most boxes) warrants a smaller exploratory position.
Risk rules
- Cap position size at the premium of the flow signal. If the institutional print was $250K, your position should be a fraction of that — not a matching bet.
- Use the chart to set your stop. Flow tells you direction; price action tells you where you're wrong.
- Track every flow signal you follow, whether you trade it or not. After 30–50 signals, you'll have a personal performance model that tells you which filter combinations actually work for your style.
Daily workflow
A practical routine: scan the first 30 minutes for high-premium sweeps, grade each print against your checklist, cross-reference with your watchlist and the catalyst calendar, log the top two or three setups in your idea journal, then build a trade plan only for the ones that pass all filters. Morningoptions' five-pipeline AI vetting applies a similar graded approach — scan, score, surface — which maps directly onto this workflow for traders who want a pre-vetted starting point each morning.
Pro Tip: The first session you use flow, watch without trading. Study 20–30 prints against subsequent price moves. You'll immediately see which signal combinations have follow-through and which are noise in your specific market environment.
When you're ready to act on flow signals faster, execution speed matters — especially in the first 30 minutes when the best prints are live and moving quickly.
Key Takeaways
Options flow analysis is most reliable when aggressive execution (sweeps at-ask), fresh Vol/OI (5x or higher), accumulation across multiple prints, and a confirmed catalyst all align in the same direction.
| Point | Details |
|---|---|
| Flow is a confirming layer | Use flow alongside price action, IV, and catalyst context — never as a standalone signal. |
| Vol/OI filters out noise | A ratio of 5x–20x confirms fresh institutional money; below 1x likely means a roll or close. |
| First 30 minutes is highest quality | Institutional desks execute overnight-researched strategies at the open; late-day prints skew toward closes and hedges. |
| Accumulation beats single prints | Repeated aggressive prints on the same strike and expiry carry far more conviction than one large isolated sweep. |
| Morningoptions pre-vets the flow | Morningoptions' AI pipeline scores and ranks flow-based trade ideas each morning, delivering graded setups with entry levels before the open. |
Why flow is a tool, not a crystal ball
The traders I see get burned by options flow are almost never the ones who misread a single print. They're the ones who stopped applying filters after a few wins made them feel like they had the edge figured out. Flow is probabilistic evidence, not insider information. Even the cleanest sweep — large premium, at-ask, 10x Vol/OI, confirmed accumulation — is still a bet on what a large player thinks will happen. Large players are wrong, too.
What flow genuinely offers is a window into where conviction is concentrating in the market. When you combine that with a disciplined checklist, a catalyst calendar, and honest journaling of your own results, it becomes a real edge. Without that structure, it's just expensive noise with a fancy interface.
The traders who use flow best treat it the way a good detective treats a tip: worth investigating seriously, not worth acting on blindly. Build your filters, require accumulation, confirm with the chart, and track your outcomes. The edge compounds over time — not from any single print, but from the discipline you apply to hundreds of them.
Morningoptions: vetted flow ideas delivered every morning
Most flow scanners hand you a raw feed and leave the grading to you. Morningoptions takes a different approach: every morning before the open, its five-pipeline AI vetting process scores and ranks the day's highest-conviction options setups — specific contracts, entry levels, and the reasoning behind each idea, not a list of unusual prints to sort through yourself.

The free daily briefing gives you ranked trade ideas before the market opens. The Pro tier ($89/month) adds a lunchtime scanner and an on-demand AI chat scanner so you can research any ticker in real time throughout the session. For active traders who want to apply the flow-reading discipline this guide describes without spending an hour each morning triaging raw tape, that's a meaningful time advantage. Start with the free briefing and see whether the graded setups match your own filter criteria — no commitment required.
Useful sources and further reading
A short reading list for traders who want to go deeper on flow methodology, scanner features, and regulatory context:
- Barchart Options Flow: a free starting point for viewing large institutional prints across U.S. exchanges; useful for getting familiar with the raw tape before committing to a paid scanner.
- TradesViz Options Flow Glossary: detailed definitions of flow terminology and filter logic; recommended for understanding how scanners grade prints and for building your own filter criteria.
- TradeAlgo: What Is Options Flow: a beginner-friendly primer on flow concepts and the distinction between flow and raw volume; good for foundational reading.
- ProfitBuilders: How to Read Options Flow: practical guidance on aggression, sweeps, blocks, and timing; recommended for traders ready to move from definition to execution.
- InsiderFinance Live Flow: a live feed with sweep detection and sentiment scoring; useful for comparing scanner output against your own manual reads.
- OCC Market Structure Overview: primary source for understanding U.S. options clearing, multi-exchange routing trends, and sweep mechanics at the regulatory level.
- CBOE Market Data: primary source for options volume statistics, short-dated options share of total volume, and exchange-level data; useful for verifying claims about market structure.
- Barchart: Mastering Options Flow Analysis: a deeper methodology guide covering false positives, noise sources, and advanced interpretation; recommended after you've spent a few weeks reading live flow.