
Options sentiment shows where real capital is positioning ahead of price, giving active traders a forward-looking edge that price charts alone cannot provide. The CBOE's put/call data, implied volatility (IV) rank, and unusual options activity (UOA) all reflect decisions made with real money at risk — not opinions, not surveys. That distinction is what makes options market analysis worth building into your daily workflow.
- What it reveals: Options flow exposes directional conviction, hedging pressure, and expected-move sizing across strikes and expiries. When institutions buy call sweeps at out-of-the-money strikes or pile into index puts, that positioning shows up in open interest and volume before it shows up in price.
- How traders use it: Entry timing, position sizing, hedge calibration, and earnings-structure selection all improve when you layer sentiment signals on top of price action. A call OI cluster at a resistance level, for example, can confirm a breakout setup or warn that a ceiling is being defended.
- The key caution: Options data in isolation can mislead. Extreme put/call readings can persist far longer than expected, and single-name flow gets overwhelmed during macro shocks. Always confirm with price action and check the broader regime before acting.
Morningoptions runs a five-pipeline AI process that ingests these signals every morning and delivers ranked, specific contract ideas before the open — so you spend less time scanning and more time deciding.
Table of Contents
- What are the core options-sentiment indicators every trader must know?
- How do traders convert sentiment signals into real trade decisions?
- What do options-sentiment signals actually not tell you?
- Where do you actually get the data to run these checks?
- How does an AI scanner operationalize options sentiment?
- Key Takeaways
- The habit that actually makes options sentiment useful
- Morningoptions puts sentiment signals to work before the open
- Useful sources and further reading
What are the core options-sentiment indicators every trader must know?
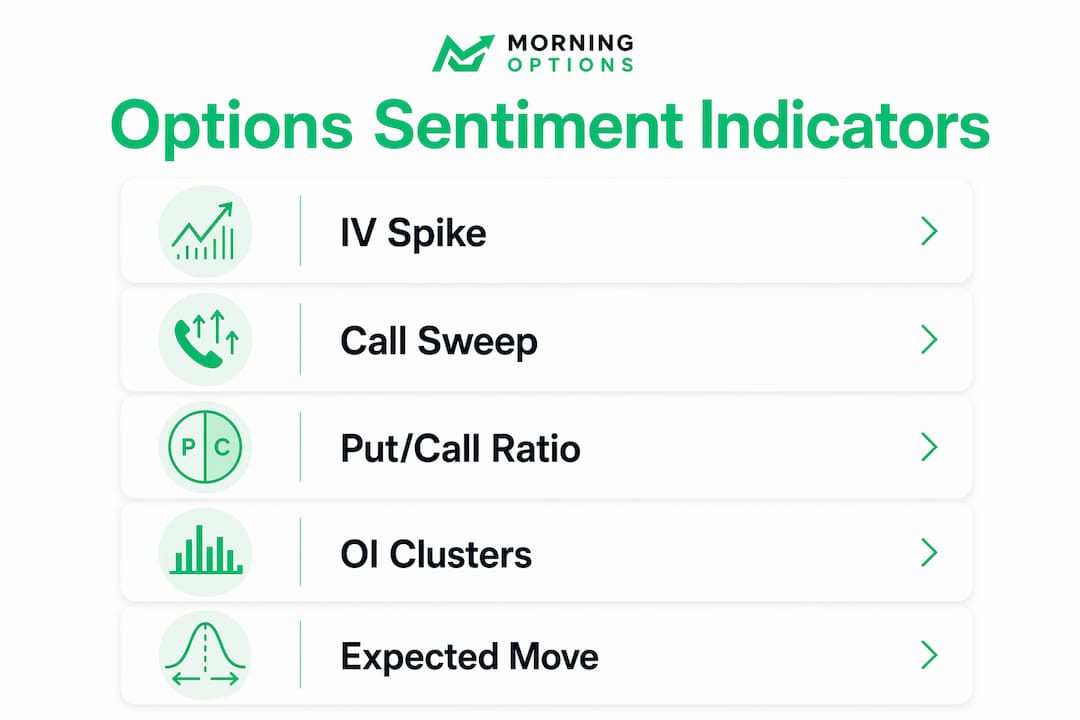
Understanding options sentiment starts with knowing which numbers to read and what each one actually measures. Here are the indicators that matter, what they signal, and where to find them.
- Implied volatility (IV) and IV rank/percentile: IV measures the market's expected move priced into an option. IV rank (IVR) contextualizes it — a 40% IV means little without knowing whether that's high or low for that ticker. High IVR signals expensive premium; low IVR signals cheap premium relative to history.
- Put/call ratio (equity and index variants): Compares put volume to call volume. A ratio above 1.0 signals more put buying (fear or hedging); below 0.7 often reflects complacency or bullish positioning. Index put/call ratios tend to reflect institutional hedging; equity ratios are noisier.
- Expected move: Derived from at-the-money straddle pricing, this gives you the market's one-standard-deviation range for a given expiry. Useful for sizing positions and calibrating probability around events.
- VIX and volatility indices: The CBOE's VIX measures 30-day implied volatility on the S&P 500. Spikes signal fear; sustained low readings signal complacency. Watch the term structure — when front-month VIX exceeds back-month, the market is pricing near-term stress.
- Open interest (OI) and volume: Volume shows today's activity; OI shows total outstanding contracts. Together, they reveal whether activity is fresh positioning or just rolls and adjustments. High volume above existing OI often signals new institutional money entering.
- Unusual options activity (UOA) and sweeps: Large orders split across multiple exchanges to fill quickly. Sweeps signal urgency — someone needs to be in the trade now, not at a better price later. That urgency is informative.
- Skew and volatility smile: When OTM puts carry significantly higher IV than OTM calls, the skew is negative — the market is paying up for downside protection. Steep skew on a single name ahead of earnings signals asymmetric fear.
- Max pain and strike/expiry concentration: Max pain is the price at which the most options expire worthless. Heavy OI concentration at specific strikes can act as a gravitational pull near expiry.
Callout 1 — IV spike into earnings: When a stock's IV rank jumps above 80 in the week before earnings, the market is pricing a large move. Selling premium (iron condors, strangles) becomes statistically attractive — but only if you've confirmed the expected move range and sized accordingly.
Callout 2 — OTM call sweep ahead of a catalyst: A sweep of 5,000 contracts at a strike 15% above the current price, with volume 10x the existing OI, is not a hedge; it's a directional bet with urgency. Options positioning often reveals directional intent before price moves because the delta-hedging flow from market makers interacts directly with the underlying stock.
Indicator quick-reference table
| Indicator | Timeframe focus | Typical trader read |
|---|---|---|
| Short-dated IV | Immediate event pricing | Sizing the expected move for a binary event |
| IV rank/percentile | Historical context | Cheap vs. expensive premium for structure selection |
| Put/call ratio | Daily/weekly sentiment | Contrarian signal at extremes; hedging pressure gauge |
| VIX term structure | Macro regime | Near-term stress vs. longer-term calm |
| OI + volume (fresh vs. roll) | Intraday/daily | Institutional entry vs. position management |
| Skew/smile | Structural tail risk | Asymmetric fear; protection demand at specific strikes |
| UOA / sweeps | Intraday urgency | Directional conviction with time pressure |
Pro Tip: In thinkorswim, open the Trade tab on any ticker and add the "Impl Vol," "Open Int," and "Volume" columns to your options chain. The "Expected Move" figure appears at the top of the chain view — it's the market's one-standard-deviation range for that expiry, calculated directly from at-the-money straddle prices.
How do traders convert sentiment signals into real trade decisions?
Knowing the indicators is one thing. Knowing how to act on them is another. Here's how experienced traders translate sentiment readings into entries, sizing, and hedges.
1. Breakout confirmation using call OI clusters
Trigger: A stock is pressing against resistance. You notice a large call OI cluster at the breakout level — 10,000+ contracts at the $150 strike with volume running 4x OI over two sessions.

Entry: Wait for price to close above the resistance level on above-average volume. The call cluster tells you the market has already priced conviction at that level; a price close confirms the follow-through.
Sizing rule: Risk no more than 1–2% of account on the options premium. If the expected move is $8 and you're buying calls, your strike selection should sit within that range.
Exit: If price stalls below the strike within two sessions, close the position. Time decay accelerates against you once the catalyst window passes.
2. Hedging an equity long using index put spikes
When the VIX term structure inverts and index put/call ratios spike above 1.3, institutional hedging is accelerating. That's not a sell signal for your long — it's a signal to buy protection cheaply relative to the fear already priced in.

Sizing the hedge: A common rule of thumb is to buy SPY puts sized to cover 20–30% of your equity exposure during high-correlation regimes. During macro shocks, index-level signals dominate single-name flow, so hedging at the index level is more efficient than stock-by-stock protection.
3. Earnings trade using expected move and IV rank
Setup: IV rank is above 75 heading into earnings. The expected move is ±8%. The stock has moved less than 5% in three of its last four reports.
Structure: Sell a strangle or iron condor with short strikes just outside the expected move. Collect premium while the market overpays for uncertainty.
Risk rule: Define your max loss before entry. Never sell naked options into earnings without a defined-risk structure.
Tactical scan checklist
- Scan for UOA daily — filter for volume at least 3x OI on a single strike, with a sweep designation. Options chain analysis using volume-to-OI ratios is one of the most reliable ways to spot institutional footprint.
- Read OI changes overnight — rising OI with rising price and call volume confirms fresh bullish positioning, not just rolls.
- Use skew to size protection — when single-name skew steepens sharply, the cost of puts is rising. Either reduce your long exposure or buy puts before the skew gets more expensive.
- Calibrate position size to expected move — if the expected move is $10 and you're buying calls, your breakeven at expiry should sit comfortably within that range. Buying far outside it is a lottery ticket, not a trade.
Pro Tip: Always check the market regime before acting on single-name flow. When the VIX is spiking and implied correlation is elevated, individual stock signals lose predictive value. Macro first, then single-name.
What do options-sentiment signals actually not tell you?
This is where most retail traders get burned. Options sentiment is a powerful input, but it has real limits — and misreading it is expensive.
Common pitfalls:
- Mistaking hedges for directional bets: A fund buying 50,000 SPY puts may be protecting a $2 billion equity long, not predicting a crash. The raw signal looks bearish; the context is neutral.
- Misreading roll activity as fresh positioning: When a large OI position rolls from one expiry to the next, volume spikes without any new directional intent. Volume alone doesn't tell you this — you need to compare it against OI changes.
- Over-interpreting gamma near expiry: In the final days before expiration, options market makers hedge aggressively around high-OI strikes. This can create short-term price pinning or whipsaw that has nothing to do with fundamental direction.
- Ignoring macro regime shifts: Single-stock flow can be overwhelmed during macro-driven index moves. When implied correlation (COR3M) spikes and VIX moves sharply, your carefully read single-name setup becomes noise.
- Acting on extremes too early: Extreme put/call readings can persist longer than expected. Sentiment is a thermometer, not a timer — it tells you the temperature, not exactly when the fever breaks.
Signal validation checklist:
- Does volume exceed OI on the strike? If yes, it's likely fresh money, not a roll.
- Is the strike/expiry concentration meaningful, or spread thinly across many strikes?
- Has price shown any follow-through in the direction of the flow?
- Is the VIX elevated or the term structure inverted? If yes, weight index signals over single-name.
- Does the move make sense given the macro calendar (Fed, CPI, earnings)?
Theta matters more than most retail traders admit. When you buy directional options based on a sentiment signal, time decay starts working against you immediately. A call sweep you spotted on Monday may have been placed by an institution with a two-week horizon and a much larger capital buffer. If price doesn't move within your theta window, the trade fails even if the signal was right. For evaluating options trade ideas quickly, always factor in how many days of decay you can afford before the position needs to show profit.
Where do you actually get the data to run these checks?
You don't need an institutional terminal. Most of the data you need is either free or available through a standard brokerage account.
| Source | What it provides | Where to find it |
|---|---|---|
| thinkorswim (TD Ameritrade/Schwab) | Full options chain: IV, IV rank, OI, volume, expected move, bid/ask | Trade tab → chain view; add "Impl Vol," "Open Int," "Volume" columns |
| CBOE (cboe.com) | VIX data, equity and index put/call ratios, historical volatility | Market Data → Delayed Quotes; VIX page; Put/Call Ratio page |
| Broker chain views | Volume/OI per strike, last price, bid/ask spread | Standard options chain in any major broker platform |
| Options-flow scanners | Real-time UOA, sweeps, large block trades, urgency flags | Typically paid services; filter by volume/OI ratio and sweep type |
Practical notes on accessing the data:
- CBOE's put/call ratio and VIX data are free and updated daily. They're your first macro-level sentiment check before the open.
- thinkorswim provides IV rank and expected move natively in the chain view. No add-ons needed. The expected move column shows the market's priced range for each expiry directly.
- Real-time options flow (sweeps, block prints) requires a paid scanner. Delayed data is available through most brokers but misses the urgency signal that makes sweeps actionable.
- For options volume signals and OI interpretation, free broker data is sufficient for end-of-day analysis. Intraday flow requires real-time feeds.
Free vs. paid breakdown: CBOE index data, broker chain views, and end-of-day OI/volume are all free. Real-time flow scanners with sweep detection are typically subscription-based. Start with free data to build your read, then add a flow scanner once you know what you're looking for.
It's also worth noting that cross-asset regime checks — like comparing options positioning in equities against institutional activity in other asset classes — can sharpen your read on whether risk appetite is shifting broadly or staying contained to one sector.
How does an AI scanner operationalize options sentiment?
Morningoptions runs a five-pipeline AI vetting process that converts raw options data into ranked, specific trade ideas before the market opens. Here's how the workflow operates.
Data inputs the scanner ingests:
- Live options prints: volume, OI, strike, expiry, trade type (sweep vs. block vs. split)
- IV surface across strikes and expiries for each ticker
- Skew readings (put/call IV differential at equivalent deltas)
- Expected move per expiry
- Index correlation measures (VIX regime, sector-level correlation)
Scoring and filtering steps:
- Fresh-money filter: volume must exceed OI on the flagged strike to qualify
- Strike/expiry concentration check: is the activity concentrated at a meaningful level or scattered?
- Urgency flag: sweep designation gets weighted higher than a single block
- IV regime adjustment: signals in low-IVR environments get different weighting than signals in high-IVR environments, because the cost of being wrong differs materially
Example of a ranked idea (anonymized):
A mid-cap tech ticker shows a call sweep of 3,200 contracts at a strike 8% above the current price, with volume running 6x OI. IV rank is 28 — low relative to the expected move for the upcoming earnings date. The scanner flags this as a high-conviction bullish signal: fresh money, urgency, and cheap premium relative to the expected move. The ranked output includes the specific contract (strike, expiry), a suggested entry range, and a risk note tied to the expected move boundary.
Morningoptions delivers AI-powered daily briefings every market morning — ranked contract ideas with entry levels, not vague commentary. The five-pipeline vetting process scores each idea on fresh-money confirmation, sweep urgency, IV regime fit, and price-action alignment before it reaches your screen.
The Morningoptions scanner is built specifically for active retail traders who want the sentiment work done before the open. Free daily briefings are available; the Pro tier ($89/mo) adds a lunchtime scanner and an on-demand AI chat for researching specific tickers.
This is general information, not trading advice. Always validate scanner ideas against your own risk rules and current price-action context.
Key Takeaways
Options sentiment analysis gives traders a measurable edge by revealing where real capital is positioned before price confirms the move — but only when combined with price action and regime awareness.
| Point | Details |
|---|---|
| Fresh money vs. rolls | Volume exceeding OI on a strike signals new positioning, not just adjustments. |
| Confirm with price action | Sentiment extremes can persist; always wait for price follow-through before entering. |
| Regime check first | During macro shocks, index-level signals (VIX, COR3M) override single-name flow. |
| Expected move for sizing | Use the at-the-money straddle price to calibrate position size and strike selection. |
| Morningoptions daily edge | Free AI-ranked briefings deliver pre-market sentiment signals as specific contract ideas. |
The habit that actually makes options sentiment useful
Most traders read about options sentiment and then use it inconsistently — checking it when they remember, ignoring it when they're already in a trade. The traders who get consistent value from it treat it like a pre-flight checklist, not an occasional reference.
Three habits worth building:
Morning scan routine (15 minutes before the open): Pull the CBOE put/call ratio and VIX term structure first. If the term structure is inverted or the equity put/call is above 1.2, you're in a risk-off regime — size down on directional longs and weight hedges higher. Then scan your watchlist for overnight OI changes and any flagged sweeps from the prior session close.
Pre-trade checklist before acting on flow: Before entering any trade triggered by options sentiment, run through the validation checklist from the interpretation section above. Does volume exceed OI? Is there price follow-through? Does the macro regime support the signal? Two minutes of checking prevents the most common misreads — the hedge mistaken for a directional bet, the roll mistaken for fresh money.
Expiry and roll awareness: The week before monthly expiration, gamma effects intensify around high-OI strikes. Reduce your reliance on short-dated signals during that window and shift your read to the next expiry cycle. Institutions roll large positions in the final week; that volume is noise, not signal.
These habits reduce false signals not by making you smarter, but by making your process consistent. A high-probability trade isn't just about finding a good setup — it's about filtering out the setups that look good but aren't.
Morningoptions puts sentiment signals to work before the open
Every morning before the market opens, Morningoptions delivers ranked, specific options trade ideas — not a list of tickers to watch, but actual contract recommendations with entry levels, risk notes, and the sentiment signals that triggered each idea.

The five-pipeline AI process handles the sweep detection, IV regime checks, fresh-money filtering, and skew analysis so you don't have to run those scans manually. Each ranked idea includes the strike, expiry, suggested entry range, and a risk tag tied to the expected move. Free daily briefings give you the pre-market read every session. The Pro tier at $89/month adds a lunchtime scanner that catches mid-session flow shifts, plus an AI chat scanner for researching any ticker on demand.
If you've been reading options sentiment manually and finding it inconsistent, the issue usually isn't the signals — it's the volume of data to process before the open. Start with the free briefings and see how ranked, pre-vetted ideas change your morning workflow.
Useful sources and further reading
- CBOE VIX and Put/Call Data — Primary source for VIX methodology, daily equity and index put/call ratios, and historical volatility data. Free and updated daily.
- Investopedia: Volume and Open Interest — Clear explanation of how volume and OI function as sentiment and liquidity gauges, with interpretation examples.
- SwapHunt: Options Directional Intent — Covers the structural mechanics of delta-hedging and why OTM clusters can precede spot moves.
- Traders Agency: Options Chain Analysis — Practical how-to on reading the chain, spotting institutional clusters, and applying volume/OI thresholds.
- Saxo Bank Options Brief — Real-world example of how macro shocks shift implied correlation and overwhelm single-name signals.
- Lemon Juice Labs: Options Sentiment Guide — Covers put/call ratio as a contrarian tool, sweep detection, and the persistence of sentiment extremes.