
Gamma exposure (GEX) measures how much dealer hedging flow will hit the market as underlying prices move, based on the gamma of every outstanding option contract. Positive aggregate gamma means dealers hedge in the opposite direction of price moves, damping volatility. Negative aggregate gamma means they hedge with the move, amplifying it. The rest of this piece walks through the calculation, the key strike levels, the live tools, and where GEX estimates break down.
TL;DR:
- Gamma exposure can shift rapidly near expiry, and large open interest concentrations at particular strikes can vanish overnight as those options roll off.
- The zero-gamma flip point indicates a regime change from damping to amplifying hedging flow, influencing how aggressively traders should size positions.
- Relying solely on static end-of-day GEX data is risky; real-time tools and cross-checking with price action and implied volatility provide more accurate insights.
- Large dollar gamma concentrations near large strikes require cautious positioning, as dealer hedging can cause sudden reversals in those zones.
- Most GEX signals serve as probabilistic regime markers, not precise price targets, and should always be confirmed with actual market movements.
Table of Contents
- What Gamma Exposure Measures and Why It Matters
- How Is Gamma Exposure Calculated?
- Reading GEX Output: Call Wall, Put Wall, and Zero-Gamma Flip
- Where Can You Check GEX in Real Time?
- How Traders Use GEX to Adjust Strategy and Sizing
- What Doesn't Gamma Exposure Tell You?
- How MorningOptions Builds GEX Into Daily Trade Ideas
- Why Most GEX Explainers Miss the Point
- Get GEX-Aware Trade Ideas Before the Open
- Sources
What Gamma Exposure Measures and Why It Matters
Delta tells you how much an option's price moves when the underlying moves. Gamma tells you how fast that delta changes. Dealers who sell options to the market don't want directional risk, so they hedge by buying or selling shares to stay delta neutral when gamma across the market is positive, dealers buy dips and sell rallies to keep their hedges balanced. That buying-low-selling-high behavior acts like a shock absorber.
Flip the sign and the mechanics reverse. In a negative-gamma regime, dealers sell into declines and buy into rallies, adding fuel rather than absorbing it. This is the core mechanical link between options Greeks and real market behavior, not just theory on a page.
A few practical signals worth tracking alongside GEX:
- Rising implied volatility alongside deeply negative GEX often precedes sharp intraday swings.
- A low VIX paired with strongly positive GEX usually points to a quiet, range-bound tape.
- The Barchart SPX gamma exposure chart tracks this relationship over time.
- Divergence between GEX regime and VIX behavior is worth flagging as a possible setup change, not ignoring.
How Is Gamma Exposure Calculated?
The core formula is simple even though the inputs take work to gather: gamma times open interest times the contract multiplier, summed across every strike and expiration in the chain. Most equity and index options use a multiplier of 100 shares per contract. Vendors differ on whether they present the result in dollar terms (dollar gamma per 1% move) or share terms (shares to hedge per 1 point move), so the raw number only means something once you know the scaling choice.
The sign convention used by most GEX calculators treats call open interest as positive gamma and put open interest as negative gamma, on the assumption that dealers are net short calls and net short puts to retail and institutional buyers. Not every vendor agrees on this assumption, which matters more than most traders realize.
Here's a simplified walk-through:
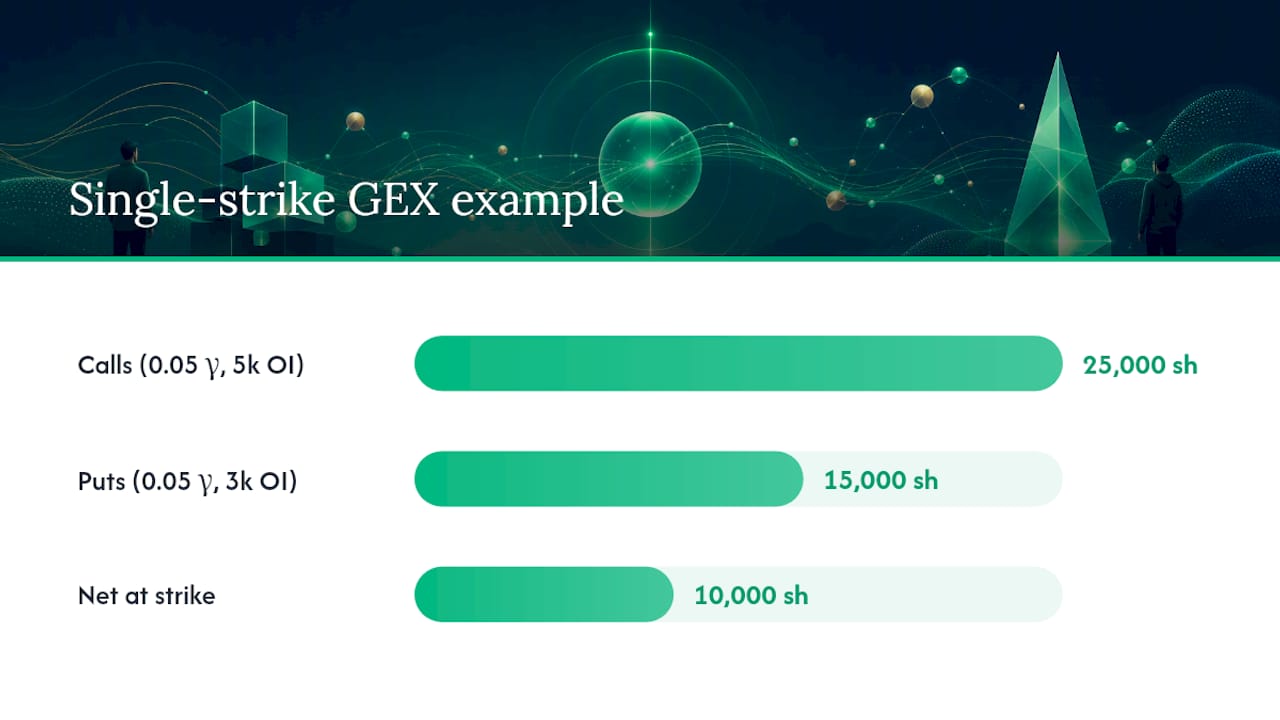
- Pick a strike, say $100, with 5,000 calls open and a gamma of 0.05.
- Multiply: 0.05 × 5,000 × 100 shares = 25,000 shares of dealer hedging exposure at that strike.
- Repeat for the $100 puts, say 3,000 contracts at the same gamma, and flip the sign: negative 15,000.
- Net that strike at positive 10,000, then repeat across every strike and expiration and sum.
Statistic Callout: A single strike's gamma exposure can swing from positive to negative within days as options approach expiration, since gamma concentrates sharply near the money as expiry closes in.
Where the cumulative sum crosses zero going up the strike ladder is the zero-gamma flip, and it's one of the most watched levels on any GEX profile.
Reading GEX Output: Call Wall, Put Wall, and Zero-Gamma Flip
A GEX profile plots net gamma by strike, and three features do most of the interpretive work. The call wall is the strike with the largest positive call gamma, often acting as a magnet or ceiling because dealers sell into rallies that approach it. The put wall works the opposite way on the downside, where dealer hedging tends to slow declines. The zero-gamma flip is the strike where cumulative gamma crosses from positive to negative, marking the boundary between a damping regime above and an amplifying regime below.
Heatmaps built on this data typically show:
- Color-coded strike rows across multiple expirations, with intensity mapped to gamma concentration.
- A highlighted flip line separating positive and negative territory.
- Intraday delta-GEX overlays showing how the profile shifts as the session progresses.
Expiry concentration deserves particular attention. Gamma clusters heavily in near-the-money options as expiration approaches, and large exposures can disappear overnight once those contracts roll off. That's exactly the kind of pin risk that shows up around monthly and quarterly expirations, especially at round-number strikes where open interest tends to cluster.
Pro Tip: Check whether a call wall or put wall is tied to a single large expiration rather than distributed evenly. A wall built almost entirely on one week's options can vanish the moment that expiry rolls off, even if the underlying price hasn't moved.
Where Can You Check GEX in Real Time?
Static end-of-day GEX numbers are useful for context, but active trading calls for something that updates during the session. Live tools generally fall into three categories: standalone GEX calculators that let you pull a single ticker's profile on demand, dashboard-style heatmaps that show multiple expirations at once, and intraday delta-GEX trackers that replay how hedging pressure built or unwound during the day. The QuantWheel real-time GEX calculator is a good example of the heatmap-plus-intraday-replay format now common among retail-facing tools.
Before trusting any vendor's read, run through this checklist:
- Confirm the unit: dollar gamma per 1% move and share gamma per 1 point move produce very different-looking numbers for the same underlying position.
- Check update frequency. Some tools refresh every few minutes; others lag by an hour or more.
- Verify which expirations are included. A profile that excludes weekly options will understate near-term gamma concentration.
- Ask how fresh the open interest data is, since OI typically updates once per day, not intraday.
Pair GEX with implied volatility term structure and actual price action rather than trading off a single number in isolation. A background on how dealer positioning research works is useful context for understanding why cross-checking matters so much here.
How Traders Use GEX to Adjust Strategy and Sizing
GEX changes how aggressively you should size a trade and which structures make sense. In a positive-gamma regime, price tends to revert toward the flip or toward the strike carrying the largest gamma concentration, which favors mean-reversion setups like iron condors or credit spreads sold around the walls. In a negative-gamma regime, moves can run further than usual once they start, which favors directional structures and wider stops rather than tight range trades.
- Identify the current zero-gamma flip level and note whether price sits above or below it.
- Choose strategy accordingly: fade extended moves in positive gamma, respect momentum in negative gamma.
- Select expirations that avoid heavy roll-off risk unless you're deliberately trading the pin.
- Size positions smaller near large dollar gamma concentrations, where dealer hedging can cause sudden, sharp reversals.
Volatility regime and GEX regime often move together, and a guide to matching strategy with volatility conditions pairs well with this framework.
Pro Tip: Treat the zero-gamma flip as a pivot for stop placement, not just a chart curiosity. A stop set just beyond the flip level acknowledges that price behavior genuinely changes character once it crosses that line.
What Doesn't Gamma Exposure Tell You?
GEX is an inference built from open interest, not a direct read of who holds which side of a trade. Open interest doesn't reveal whether a given position is opening or closing, long or short from the account holder's perspective, so vendors make assumptions to fill that gap. Those assumptions are exactly why two GEX calculators can show meaningfully different numbers from the same option chain.

Big macro or earnings events can also swamp anything a gamma profile predicts. Hedging flow is a background force, not a law of physics, and a strong catalyst overrides it easily.
Cross-check every GEX read with:
- Implied volatility term structure, to see if the options market is pricing in an event.
- Actual intraday price action, since a GEX level that isn't holding is telling you something.
- Volume-based order flow, which captures activity that open-interest models miss entirely.
How MorningOptions Builds GEX Into Daily Trade Ideas
MorningOptions runs a five-AI pipeline each morning that vets and scores setups, weighing GEX-style positioning signals alongside catalysts and technical structure before ranking ideas. The daily routine mirrors what active traders should already be doing: check the flip level and walls pre-market, watch how they shift intraday, and size positions accordingly.
Why Most GEX Explainers Miss the Point
Most write-ups on gamma exposure stop at the theory. They explain dealer hedging mechanics, maybe show a chart, and leave the reader to figure out what to actually do with it. That gap between explanation and application is the real problem, not a lack of understanding of gamma itself.
The judgment this research actually supports is narrower than most traders assume: GEX is a probability tilt on volatility character, not a price target generator. Treating the call wall as a hard ceiling or the put wall as a guaranteed floor is where traders get hurt, because walls built on a single large expiration can evaporate the moment that expiry rolls off.
What gets underweighted is the unit-and-cadence checklist. Traders will happily debate whether a stock is in positive or negative gamma while ignoring that their calculator updates once an hour and reports shares when a competing tool reports dollars. Fix the plumbing before trusting the signal.
Prioritize this: confirm your tool's assumptions first, treat the flip as a regime marker rather than a trade trigger by itself, and always let price action have the final word over any single dealer-positioning estimate.
— Customer
Get GEX-Aware Trade Ideas Before the Open
Checking gamma exposure manually every morning across dozens of tickers eats time active traders don't have. A service builds that positioning context directly into daily AI-ranked briefings, so you see specific contract ideas with entry levels already weighed against the day's setups, not a raw data dump you have to interpret yourself.

The free daily briefing covers ranked trade ideas each market morning. A paid tier adds a lunchtime scanner and a chat scanner for researching any ticker on demand, including expiry-aware scans that account for roll-off risk. If a position needs a hedge outside equities entirely, diversifying into precious metals during volatile stretches is worth a look too. Head to Morningoptions and sign up for tomorrow's briefing before the next session opens.
This article is general information, not a substitute for advice from a qualified financial advisor. Consult a qualified financial professional about your own circumstances before acting on anything here.