
A repeatable, probability-first scan beats idea-hunting every time: combine IV rank or percentile, expected move, liquidity, delta and days-to-expiration rules, and event filters into one screen, and you'll surface tradable setups in minutes instead of hours. Screening high probability options trades isn't about finding a magic indicator. It's about running the same numeric checklist every morning so emotion never picks your strikes.
Here's the quick-scan version you can run today:
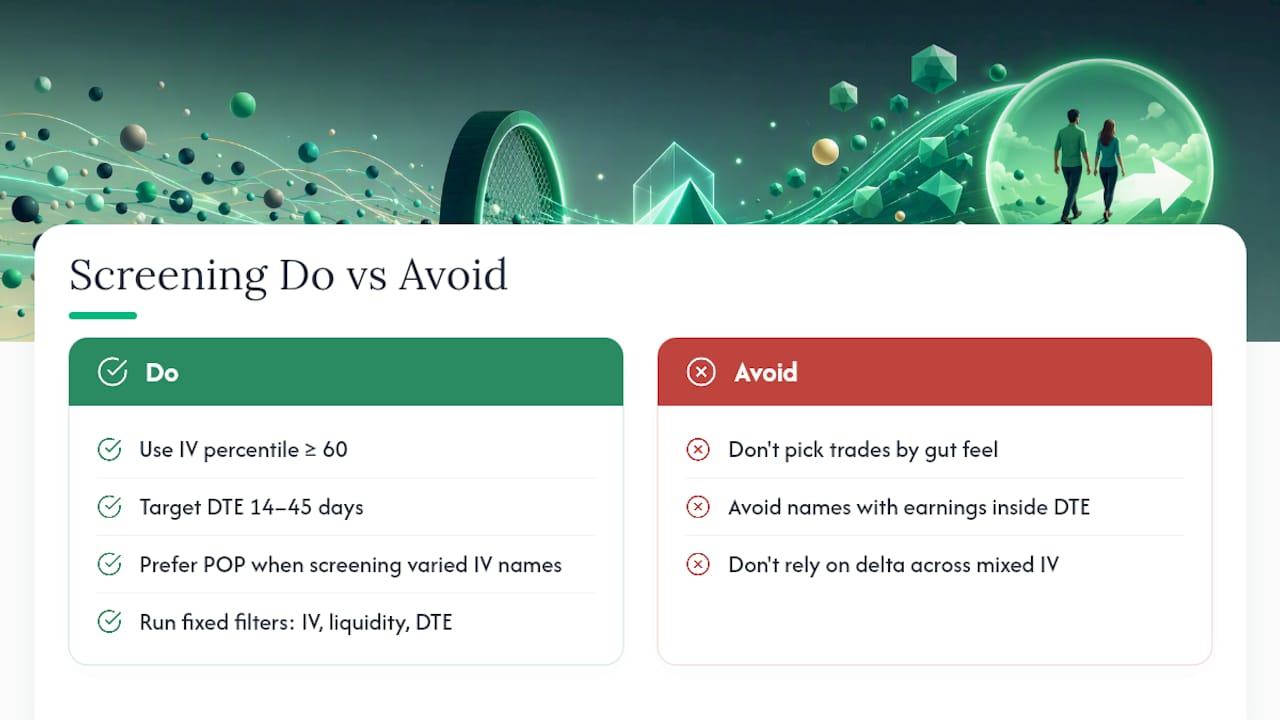
- IV percentile ≥ 60 for premium selling (≤ 30 if you're buying premium instead)
- Short-strike delta between 0.10 and 0.25 for credit spreads and iron condors
- DTE band of 14–45 days, depending on how actively you manage the position
- Minimum daily option volume of 100 contracts (500+ for ETFs) and open interest above 500
- No earnings or ex-dividend date inside your DTE window unless you're trading the event on purpose
Pro Tip: Check the expected move before you finalize short strikes. If your short strike sits inside the market's own expected range, you've already given up your edge before the trade opens.
Key Takeaways
Screening high probability options trades works when IV percentile, liquidity, delta and DTE bands, and event filters get applied in a fixed order every time.
| Point | Details |
|---|---|
| Lead with liquidity | Filter volume and open interest first to cut the universe fast before running volatility math. |
| Use IV percentile, not just IV | Target 60–70+ for selling premium, under 30 when buying it instead. |
| Trade outside the expected move | Placing short strikes beyond the market-implied range stacks probability before entry. |
| Fix your risk before entry | Cap risk at 1–3% of account value and set mechanical exit rules ahead of time. |
| Let Morningoptions pre-rank candidates | Its AI pipeline and Signal Lab scans apply this same filter logic each morning for a ready-made shortlist. |
Table of Contents
- Screening High Probability Options Trades: Filters That Actually Matter
- The Step-by-Step Scanner Workflow
- Matching Strategies to a High-Probability Screen
- Sizing, Stops, and Assignment Risk
- A Worked Example: From Screen to Trade
- How Scanners and Probability Tools Speed the Process
- Why a Numeric Routine Beats Chasing Ideas
- Skip the Manual Screening, Start With a Ranked List
- Frequently Asked Questions
- Sources
Screening High Probability Options Trades: Filters That Actually Matter
Every filter on this list measures something specific, and skipping one usually shows up later as a bad fill or an ugly earnings gap.
Implied volatility rank vs. percentile. IV rank tells you where current IV sits relative to its high/low range over the past year. IV percentile tells you the percentage of days IV was lower than today. They diverge more than people expect on names with a single volatility spike. For premium sellers, look for IV percentile of 60 to 70 or higher. For debit buyers, flip it: under 30 means you're not overpaying for premium.
Liquidity thresholds. Multi-filter screeners that combine volume and open interest matter because the options market trades a very large daily volume of contracts, and manually eyeballing chains doesn't scale. A workable floor: option volume of at least 100 contracts for single stocks, 500 for ETFs, with open interest minimums of 500 and 2,000, respectively. Volume alone hides a lot of sin. A name can print 300 contracts today and still carry a $0.40 bid-ask spread that eats your entire edge on entry and exit.
Delta and DTE bands. Sellers commonly target short-strike deltas of 0.10 to 0.25, pairing that with a DTE range of 14–30 for faster theta decay or 30–45 for more room to adjust. Shorter DTE (0–7 days) accelerates gamma risk, meaning small stock moves swing your P&L fast. Longer DTE gives you more cushion but slower decay.
| Filter | Threshold | Why it matters |
|---|---|---|
| IV percentile (sellers) | 60–70+ | Richer premium, more room to be wrong |
| IV percentile (buyers) | ≤ 30 | Avoids overpaying for time value |
| Short-strike delta | 0.10–0.25 | Proxy for distance from current price |
| DTE | 14–45 | Balances theta decay against gamma risk |
| Option volume | 100+ (500+ ETFs) | Baseline for executable fills |
| Open interest | 500+ (2,000+ ETFs) | Signals depth beyond a single day's activity |
Events and expected move. Earlier research shows implied volatility on individual names typically rises 15–40% in the five days before earnings and then collapses 30–60% afterward. That swing is exactly why an earnings filter belongs in your screen, not as an afterthought. Set a buffer excluding names with earnings inside your DTE window unless you're deliberately trading the volatility crush. Then layer in expected move: the market-implied range for the underlying by expiration. Placing short strikes outside that range stacks probability in your favor before you even glance at a chart.
Pro Tip: When your account size is limited, lean on liquid ETFs like SPY or QQQ. Tight spreads there forgive small mistakes that would cost you real money on a thin single-name option.
The Step-by-Step Scanner Workflow
Running filters in the right order saves time and prevents you from falling in love with a candidate before you've checked the boring stuff.
- Narrow the universe first. Filter by market cap and sector before touching options data. A screen of 6,000 optionable tickers becomes 400 once you cut anything under $2 billion market cap or outside sectors you actually understand.
- Apply liquidity, then IV percentile, then DTE, then delta. This order matters because liquidity eliminates the most names fastest, so you're not wasting compute (or your own attention) running volatility math on stocks you'd never trade anyway.
- Score what's left. A simple weighted score works: IV percentile 30%, liquidity 25%, probability of profit 30%, expected-move cushion 15%. Rank your remaining 30 to 50 names and keep the top 10.
- Run manual checks on the top 10. Look at the chart for obvious support/resistance, confirm no surprise catalyst snuck past your event filter, and scan for unusual options flow that might signal something the screener missed.
- Size and check return on capital. Before anything moves to your watchlist, run a quick credit-to-max-loss ratio. If it's below what you'd accept for the probability offered, cut it.
Export your final list to a watchlist and set price alerts at your intended strikes. A scanner built around presets turns this five-step routine into a five-minute morning habit instead of an hour of chain-flipping.
Matching Strategies to a High-Probability Screen
Once your shortlist is ranked, the strategy choice mostly depends on how much directional risk you're willing to carry.
- Iron condors and credit spreads work best when a name is boxed between clear support and resistance with elevated IV. One tracked example applying conservative strikes on liquid ETFs produced win rates above 80%, though higher probability of profit always comes paired with smaller credit received.
- Short puts and cash-secured puts suit accounts that wouldn't mind owning the underlying at the strike, turning a screened candidate into either income or a disciplined entry.
- Covered calls are the conservative, account-level version of a high-probability idea, useful if you already hold shares and want to monetize a name that cleared your screen.
- Directional spreads or outright buys make sense when a screened candidate shows unusual volume or momentum rather than a neutral setup. That's a different playbook, worth checking against a guide to bullish structures before you flip from selling premium to buying it.
Pro Tip: When liquidity is thin or assignment risk feels elevated, default to defined-risk structures. A vertical spread caps your downside in a way a naked short put never will.
Sizing, Stops, and Assignment Risk
None of the screening work matters if one bad position wipes out three months of gains, so risk rules come before execution, not after.
- Position sizing: cap risk per trade at 1 to 3% of account value, and calculate capital at risk on a spread as the width between strikes minus credit received, times 100 shares per contract.
- Max loss and stop rules: decide your exit before entry. A common mechanical rule is closing at 50% of max profit or 2x credit received as a loss, whichever comes first.
- Execution details: always use limit orders, check bid-ask width before entering (anything wider than 10% of the option's price is a red flag), and leg into multi-leg trades carefully rather than chasing a fill.
- Assignment awareness: short options carry early-exercise risk, especially around ex-dividend dates, when in-the-money calls become assignment targets the day before the stock goes ex-dividend.
Quick math: sell a 5-point-wide put credit spread for $1.50 credit. Never trade into an earnings print or major macro release without an extra hedge or a smaller size than usual.
A Worked Example: From Screen to Trade
Start with the filter set from earlier: IV percentile ≥ 65, option volume ≥ 500, open interest ≥ 2,000, DTE 30–45, no earnings inside that window. On a typical morning that screen against a liquid ETF universe might return eight to twelve names.
Say the screen surfaces a broad-market ETF trading at $450 with IV percentile at 71, average daily option volume near 40,000 contracts, and no earnings event (ETFs don't report anyway, which is part of why they screen clean). The expected move over 35 days works out to roughly $22 in either direction.
Both short strikes sit outside the $22 expected move, which is the entire point. That cushion, rather than a hunch about market direction, is what gives the trade its probability edge. Breakevens land at $476.80 and $423.20, both still clear of the expected range.
How Scanners and Probability Tools Speed the Process
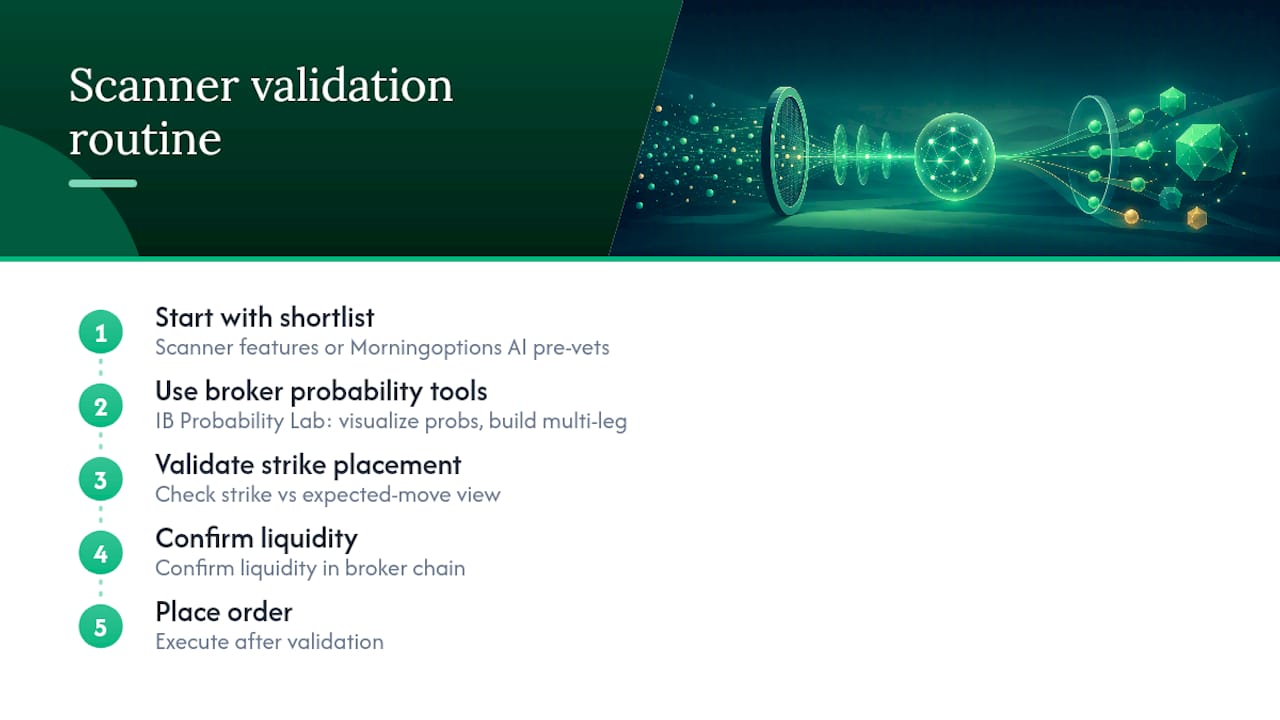
A good scanner does the heavy lifting a spreadsheet can't: real-time IV percentile visuals, an expected-move calculator built into the chain, probability-of-profit math, and saved filter presets you reuse every morning.
Broker tools matter here too. Interactive Brokers' Probability Lab visualizes market-implied probabilities and lets you build multi-leg structures against that view before committing capital, which turns an abstract "outside the expected move" rule into something you can actually see on a chart.
Morningoptions' AI pipeline runs a version of this same logic every morning, pre-vetting and ranking candidates so you start from a shortlist instead of a raw universe. The Signal Lab layer lets you run on-demand scans against your own tickers.
Pro Tip: Treat the scanner shortlist as step one, not the final answer. Validate strike placement against an expected-move view, then confirm liquidity in your broker's actual chain before you place the order.
Why a Numeric Routine Beats Chasing Ideas
I've watched more accounts get hurt by an interesting idea than by a boring one. A screen you run the same way every morning, with the same numeric thresholds, removes the temptation to override your own rules because a stock "feels" right.
That discipline is exactly what an AI scoring pipeline and a tool like Signal Lab are built to reinforce for traders who can't watch five screens all day...
Skip the Manual Screening, Start With a Ranked List
Everything above, IV percentile, expected move, liquidity, delta and DTE bands, event filters, takes real time to run by hand every single morning. Morningoptions runs that exact pipeline before the market opens and hands you a ranked list of specific contract ideas with entry levels, not a vague "watch this sector" note.

The free daily briefing gets you ranked ideas each market morning. The Pro tier at $89/month unlocks the lunchtime scanner and an AI chat scanner for researching any ticker on demand, useful when a name clears your own screen and you want a second, faster read before you commit capital. Head to the Morningoptions briefing and see today's ranked setups before you build your own scan from scratch.
Frequently Asked Questions
What does "screening high probability options trades" actually mean? It means running a fixed set of numeric filters, IV percentile, liquidity, delta, DTE, and event dates, against an options universe to surface setups statistically more likely to expire profitably, rather than picking trades on gut feel.
What's a good starting IV percentile for premium selling? Most credit-spread and iron condor sellers look for IV percentile of 60 or higher, since that signals richer premium relative to the stock's own recent volatility history.
Should I use delta or probability of profit (POP) to pick strikes? Delta works fine for a stable universe of similar names, but POP adjusts for current implied volatility, so it tends to give a more honest read when you're screening across names with very different IV levels.
How many days to expiration should I target? A 14–45 day band covers most premium-selling strategies. Shorter DTE decays faster but carries more gamma risk; longer DTE gives more room to manage but slower theta.
Do earnings dates matter if I'm not trading the earnings move on purpose? Yes. Implied volatility on individual stocks can swing 15–40% in the days before earnings and collapse just as sharply afterward, so screening out names with earnings inside your DTE window avoids unwanted volatility exposure.
This article is general information, not a substitute for advice from a qualified financial advisor. Consult a qualified financial professional about your own circumstances before acting on anything here.
Sources
- Interactivebrokers
- How This Options Expert Screens for High-Probability Spread Trades, Step-by-Step
- Options Screener Guide: How to Filter for the Best Trades in 2026 | TradeAlgo
- Options Screener: Find High-Probability Income Trades | Days to Expiry
- The High-Probability Options Strategy With an 80.4% Win Rate - Cabot Wealth Network