
The expected move is the options market's one standard deviation price range for a stock or index over a chosen expiration, and you read it straight from live quotes: add the ATM call and put mid prices, or multiply spot by implied volatility and the square root of time. Traders use it to place strikes outside a defined range, size positions around earnings, and judge whether a straddle is actually worth buying.
TL;DR:
- The expected move represents about a 68% probability that the stock stays within the range over a specific expiration, but it is often misinterpreted as a strict boundary.
- It is primarily derived from the ATM straddle price and implied volatility calculations, which generally agree unless skew, dividends, or stale quotes distort the estimate.
- The best approach is to use the most relevant expiration date for your event, such as earnings or a catalyst, and recalculate shortly before the event to account for rising implied volatility.
- Traders should place strikes just outside the expected move for short options strategies and compare their own implied move estimates against market quotes to avoid mispricing.
- Relying on a single calculation method or ignoring the inherent market skew can lead to inaccurate positioning; always cross-check using both the straddle and volatility-based formulas.
Table of Contents
- What Expected Move Tells You About Probability
- How to Calculate Expected Move: Two Methods and a Shortcut
- A Worked Example: Straddle vs. IV Formula Side by Side
- Turning the Number Into a Trade: Strikes, Sizing, and Strategy
- Where the Expected Move Breaks Down
- A Same-Day Workflow: From Calculation to Trade Idea
- What Most Traders Get Wrong About This Number
- Sources
What Expected Move Tells You About Probability
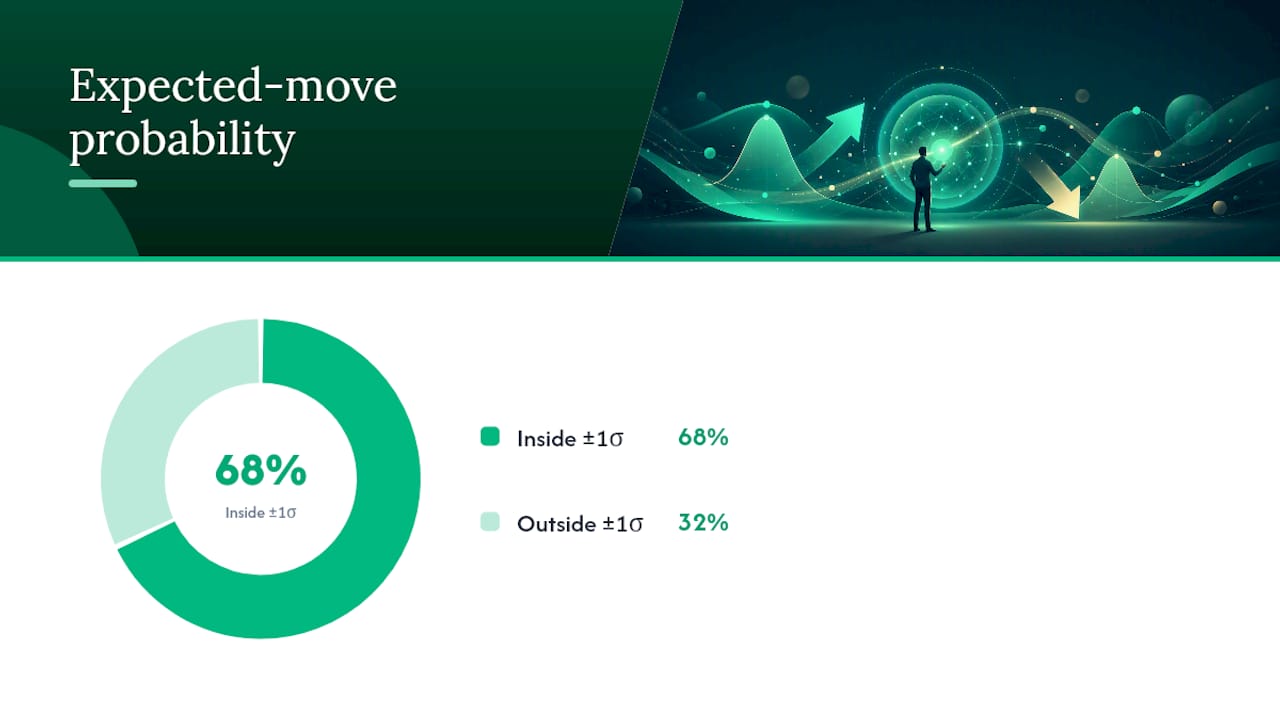
Expected move describes a one standard deviation range, which means that the stock stays inside that band roughly 68% of the time and finishes outside it about 32% of the time. That's not a rounding error. It's the single most misread part of this metric, because traders treat the boundary like a wall the stock can't cross when it's really just where the odds shift.
The number itself comes from the ATM straddle price, which reflects a market consensus built from every buyer and seller pricing that contract right now. It isn't a forecast from an analyst or a model predicting direction. It's the collective bet on magnitude, stripped of any opinion on which way the stock goes.
Timeframe changes what the number is actually telling you:
- Front-week expected move captures a specific catalyst, like an earnings print or a Fed decision landing inside that window.
- Front-month expected move smooths out day-to-day noise and reflects the market's general volatility read over a longer stretch.
- Mixing the two, checking a monthly number to size a weekly earnings trade, produces a range that's too wide for the actual event risk.
If you're trading around a single catalyst, pull the expiration closest to that date. If you're gauging general chop, the front-month figure holds up better.
How to Calculate Expected Move: Two Methods and a Shortcut
Two calculation methods dominate, and they should land close to each other if the market's pricing is clean.
- Straddle method. Find the at-the-money strike, pull the call mid price and the put mid price, and add them together. That sum is your dollar expected move for that expiration. It's the most direct, quote-based number you can get, because it comes straight from what the market is actually paying for that contract right now.
- Implied volatility formula. Expected move ≈ Spot × IV (as a decimal) × √(DTE/365). Spot is the current stock price. IV is the at-the-money implied volatility, converted from a percentage to a decimal. DTE is days to expiration, and the square root scales volatility properly across time since volatility grows with the square root of time, not linearly.
Both methods should produce a similar dollar range on a liquid underlying with clean quotes.
Rule of 16 in one sentence: divide the annualized IV by 16 (the approximate square root of 252 trading days) to get a rough one-month move percentage, since 16 is close enough to the square root of a year's trading days to work as mental math.
It's a fast gut check at your desk, not a tool for placing precise strikes. It breaks down fastest on shorter-dated options, thinly traded names, or anything with a lopsided volatility skew.
When the straddle method and the IV formula diverge by more than a few percent on the same expiration, the mismatch usually traces back to skew, dividend or carry effects, or stale quotes sitting in one leg of the straddle. Pull fresh mid prices before you trust either number.
A Worked Example: Straddle vs. IV Formula Side by Side
Here's how both methods play out on a single ticker so you can see where they agree and where they don't.
- Set up the trade. Spot price: $100. Expiration: 30 calendar days out (DTE = 30). At-the-money implied volatility: 32%.
- Run the IV formula. Expected move ≈ $100 × 0.32 × √(30/365). The square root of (30/365) comes out to about 0.287. Multiply: $100 × 0.32 × 0.287 ≈ $9.18.
- Read the straddle. Say the 30 day ATM call is trading at a $4.90 mid and the ATM put is trading at a $4.30 mid. Add them: $4.90 + $4.30 = $9.20.
- Compare and convert to a range. Both methods land within two cents of each other, a tight agreement that signals clean quotes and no meaningful skew distortion.
Outside that band sits the other 32%, split roughly evenly between a bigger rally and a bigger drop.
Turning the Number Into a Trade: Strikes, Sizing, and Strategy
The expected move only earns its keep once you use it to make an actual decision, not just admire the range.
- Placing short strikes. Sellers often set short strikes on iron condors or credit spreads just outside the expected-move band, treating that boundary as a rough statistical edge rather than a guarantee.
- Sizing an earnings trade. Compare the market's implied move to your own read on how big the reaction will be. If you think the stock moves more than the market is pricing, a long straddle or strangle has a case. If you think the market's overpricing the reaction, selling premium fits better.
- Reading probability of profit. A short strike placed right at the edge of the expected move roughly lines up with a probability of profit near 68%, before accounting for the credit collected.
- Matching strategy to view. Straddle and strangle buyers need the stock to move further than the expected move just to cover the premium they paid, while premium sellers profit whenever price stays inside that band. Investopedia's breakdown of options trading strategies is worth a look if you're still sorting out which side of that trade fits your outlook.
A covered-call writer might sell a strike sitting right at the top of the expected-move range for the next monthly expiration, collecting premium while accepting that a move beyond that boundary caps the stock's upside. An iron condor seller does the mirror version on both sides, placing short strikes past the upper and lower bounds of the same range.
Pro Tip: Recalculate the expected move a day or two before earnings, not a week out. Implied volatility usually climbs as the print approaches, and an early calculation understates the real range you'll be trading against.

Where the Expected Move Breaks Down
The math behind expected move assumes a normal or lognormal price distribution, and real markets don't fully cooperate. Actual returns carry fatter tails than the model assumes, which is exactly why the stock closes outside the 1σ range about 32% of the time rather than never. Treat the band as guide rails, not a fence.
A few checks keep you from trusting a bad number:
- Diagnose divergence. When the straddle price and the IV formula disagree by more than a couple percent, check skew and term structure before placing a trade, since a lopsided skew often means the market is pricing asymmetric downside risk.
- Use mid prices, not the last trade. A wide bid-ask spread on a thin name can distort a straddle price badly.
- Refresh the quote right before you trade. Stale data from ten minutes ago can be meaningfully off, especially heading into a catalyst.
- Check history. Compare the implied move to how the stock actually moved around its last three or four earnings reports before sizing a new position.
For anyone hedging real tail risk rather than trading a standard event, the plain 1σ estimate under Black-Scholes isn't built for pricing the wings accurately. Professionals lean on risk-neutral density extraction or jump-diffusion models for that job, well beyond what a straddle-based estimate was ever meant to do.
A Same-Day Workflow: From Calculation to Trade Idea
Running the math is the easy part. Turning it into a defined-risk trade before the opening bell is where most traders lose time, which is the exact gap Morningoptions was built to close.
Morningoptions' daily briefings surface implied-range data alongside ranked, specific contract ideas, so the expected-move figure isn't sitting in isolation. It's paired with an entry level and a bear case, not a vague comment about volatility being elevated.
A workable premarket routine looks like this:
- Pull the expected move for your ticker, either from a calculator or straight off your platform's options chain.
- Cross-check that number against Morningoptions' flagged setups for the day to see whether the platform's scoring agrees with the range you calculated.
- Choose a defined-risk structure, an iron condor or credit spread, with strikes mapped to sit just outside that expected-move band.
- Confirm your account has the approval level for the strategy you're building, since multi-leg trades typically require a higher tier than single-leg options.
Pro Tip: Run the expected-move check before you open Morningoptions' briefing, not after. Coming in with your own number first makes it obvious when the platform's flagged setup is pricing something you hadn't considered.
For strategy selection once you have the range in hand, Morningoptions' guide on options strategies for volatile markets and its beginner strategy selection guide both walk through matching a market view to a structure.
What Most Traders Get Wrong About This Number
Most retail traders either ignore expected move entirely or treat it with far more precision than it deserves. Both mistakes cost money in different ways.
The first group skips straight to picking strikes based on gut feel or a chart pattern, missing a number that's already sitting in every options chain for free. The second group treats the expected-move boundary like a hard ceiling, then panics or overtrades the moment price pokes through it, forgetting that a 32% chance of breaching that range isn't rare. It happens roughly one out of every three expirations.
The bigger error I'd flag is relying on a single calculation method and never checking it against the other. If your straddle price and your IV formula land within a percent or two of each other, trust the number and move on. If they don't, that gap is information. It's telling you something about skew or a stale quote that a lone figure would never reveal. Traders who only run one method miss that signal entirely.
Start with the math, not the platform. Calculate it yourself first on a name you already know well, then use a scanner or briefing service to cross-check your work. That order matters more than which calculator you use.
— Customer
Sources
- Options Expected Move: How to Calculate and Trade the Market's Price Prediction
- Expected Move Calculator: 1σ Implied Range from IV | OAS
- Understanding the rule of 16 in plain terms
- Options trading strategies