
Implied volatility rank tells you where an option's current implied volatility sits compared to its own range over the past year, scored from 0 to 100. A high number means premium is relatively rich and often favors selling strategies; a low number means premium is relatively cheap and often favors buying. Everything else, the formula, the traps, the platform quirks, is detail in service of that one decision.
TL;DR:
- High IV Rank indicates options premiums are expensive relative to their 52-week range, making selling strategies more attractive, especially before known catalysts like earnings.
- Divergences between IV Rank and IV Percentile can signal regime shifts or recent spikes, requiring investigation before acting on volatility signals.
- External factors like sector, macro environment, and recent events significantly influence the interpretation of IV Rank, meaning context is essential.
- IV Rank updates once daily based on end-of-day implied volatility data, so sudden market moves may not be immediately reflected on trading platforms.
- Combining IV Rank with option Greeks sharpens risk management, but using it as a sole signal often leads to guessing rather than informed trading decisions.
Table of Contents
- What Is Implied Volatility Rank (IV Rank)?
- IV Rank vs IV Percentile: Which One Should You Trust?
- How Do You Calculate IV Rank? Formula and Example
- Should You Buy or Sell Options Based on IV Rank?
- Where Does IV Rank Break Down? Lookback Traps and Regime Shifts
- How Often Does IV Rank Update, and Where Do Platforms Show It?
- How MorningOptions Uses IV Rank in Daily Trade Ideas
- How Does IV Rank Compare to Historical Volatility and Raw IV Level?
- What Does IV Rank Look Like Across Different Market Conditions?
- How Should You Combine IV Rank With Option Greeks?
- The Honest Take on IV Rank
- Sources
What Is Implied Volatility Rank (IV Rank)?
Implied volatility rank measures where a stock's current implied volatility falls between its lowest and highest reading over a set lookback period, most commonly 52 weeks. The output is a single number between 0 and 100. An IV Rank of 80 means current IV is sitting near the top of its yearly range. An IV Rank of 15 means it's near the bottom.
The intuition that trips people up is distance versus frequency. IV Rank is purely a distance calculation: it measures how far current IV sits between the floor and ceiling of the range, regardless of how often IV actually visited that area. A stock could spend 300 days a year near its low and spike once to a new high, and IV Rank would still just report the gap between wherever IV sits today and those two extremes. That's a different question than "how often has IV been this low or lower," which is what IV Percentile answers instead.
Traders generally use these rough zones as qualitative guidelines:
- When implied volatility appears elevated relative to its own history, premium selling strategies tend to be more attractive.
- Moderately elevated volatility levels warrant a second look but are not automatically a green light.
- When implied volatility seems cheap relative to its own history, premium-buying setups may be favored.
- Levels near the middle of the range are considered neutral with no strong edge from volatility alone.
None of these thresholds are laws of physics. They're heuristics traders lean on because options education consistently frames volatility metrics as context, not standalone signals.
IV Rank vs IV Percentile: Which One Should You Trust?
IV Rank and IV Percentile answer related but genuinely different questions, and mixing them up leads to bad screens. IV Rank only cares about the high and low of the lookback window. IV Percentile counts what share of trading days had implied volatility below today's level, using the entire distribution rather than just the two endpoints.
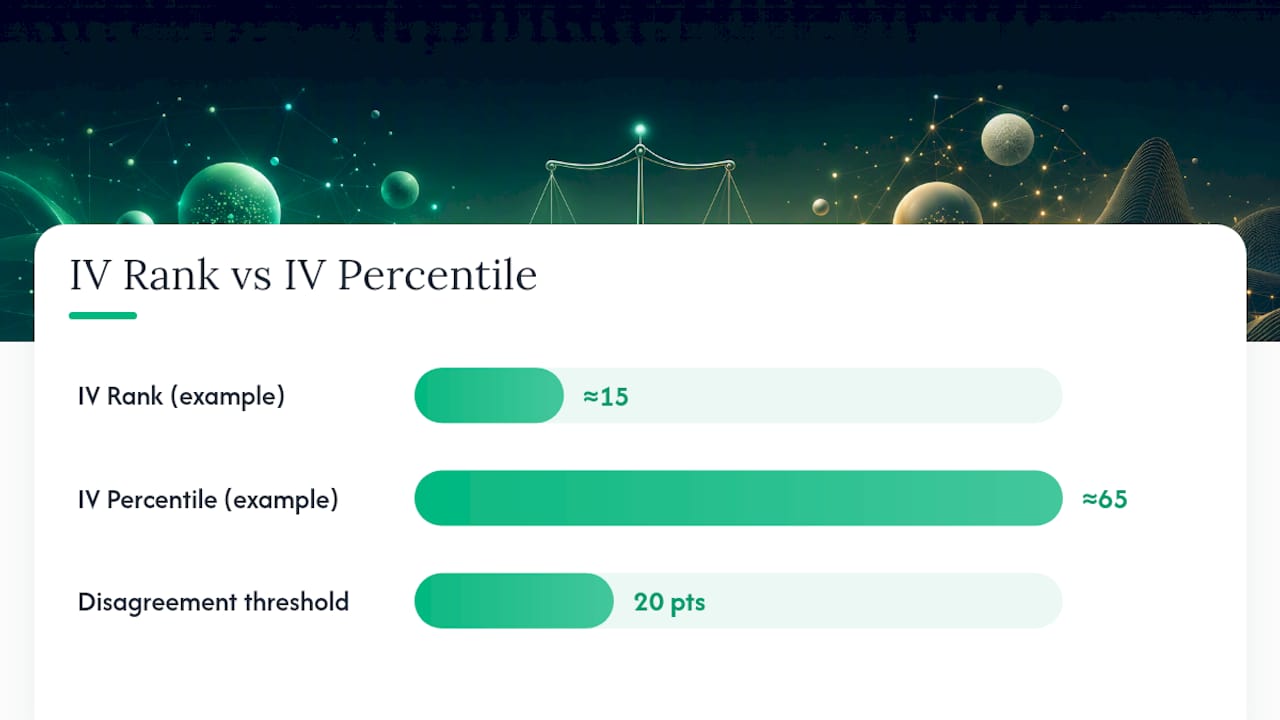
Here's where that difference actually bites you. Imagine a stock that traded calmly in the 20 to 25 IV range for eleven months, then had one violent three-day spike to 90 on a surprise event. A year later, current IV has settled back to 30. IV Rank looks at the range (20 to 90) and calculates that 30 sits close to the bottom, maybe a rank in the teens. IV Percentile looks at the full year of daily readings and sees that IV spent the overwhelming majority of its time below 30, so percentile comes back much higher, maybe in the 60s or 70s. One spike, described in ORATS' comparison of the two metrics, can distort rank for months while percentile barely moves.
That divergence is not a bug to ignore. It's information.
- Rank and percentile pointing the same direction: high confidence read.
- Rank low but percentile high (or vice versa): a spike or regime shift is skewing one of them. Investigate before trading.
- After any known outlier event (earnings surprise, macro shock, halt): default to percentile as the more reliable screen until the spike ages out of the window.
Pro Tip: When rank and percentile disagree by more than roughly 20 points, treat that gap itself as the signal. Pull up a one-year IV chart and find the spike before you size a trade off either number.
Use rank when you specifically want range-based mean reversion bets, betting that IV snaps back toward the middle of its own historical band. Use percentile when you want a cleaner read on how "normal" today's volatility actually is.
How Do You Calculate IV Rank? Formula and Example
The standard formula, laid out by Barchart's options education desk, is:
IV Rank = (Current IV − 52-week Low IV) / (52-week High IV − 52-week Low IV) × 100
Three inputs, all pulled from the same IV series for the same underlying:
- Current IV: today's implied volatility reading, usually the 30-day at-the-money figure.
- 52-week low IV: the lowest implied volatility printed over the trailing year.
- 52-week high IV: the highest implied volatility printed over the trailing year.
To build this in a spreadsheet:
- Pull a full year of daily closing IV values for the ticker.
- Find the minimum and maximum values in that column.
- Subtract the minimum from today's current IV.
- Subtract the minimum from the maximum to get the range.
- Divide step 3 by step 4, then multiply by 100.
Worked example: Say a stock's current IV is 42. Over the past 52 weeks, IV ranged from a low of 20 to a high of 60. IV Rank = (42 − 20) / (60 − 20) × 100 = 22 / 40 × 100 = 55. That's moderately elevated territory, not extreme.
IV Percentile uses a different calculation entirely: count the number of trading days in the lookback period where IV closed below today's level, divide by total trading days, and multiply by 100. If a large portion of the last year's trading days had IV below today's reading, IV Percentile reflects the percentage of such days, indicating how often volatility trades below the current level.
Should You Buy or Sell Options Based on IV Rank?
IV Rank readings translate into strategy bias, but the translation isn't mechanical. It's a filter, not a trigger.
When IV Rank is high: premium is rich relative to its own history, and selling strategies like credit spreads, iron condors, covered calls, and cash-secured puts tend to have better theoretical edge because you're collecting inflated premium. But high IV Rank often means high IV for a reason. Check the earnings calendar before you sell short-dated premium into an event; a rank of 85 heading into an earnings report isn't cheap volatility, it's compensation for a real binary risk. Widen your wings on iron condors when rank is elevated, since bigger expected moves mean more room needed on both sides, and stay aware that assignment risk climbs alongside IV on covered positions.
When IV Rank is low: buying premium gets more attractive; long calls, long puts, and defined-risk debit spreads cost less in relative terms. The tradeoff is theta. A long option in a low-IV environment still bleeds time value every day, so low IV Rank alone doesn't excuse ignoring your holding period or picking a strike too far out of the money.
Mid-range readings are where IV Rank alone won't do the work for you. This is exactly where you pull in IV Percentile, skew (is downside protection unusually expensive relative to upside calls?), liquidity (tight bid-ask spreads or wide ones?), and the event calendar.
- Check IV Rank and IV Percentile together before sizing any premium-selling trade.
- Confirm no earnings or major catalyst falls inside your trade's expiration window unless that's the specific bet you're making.
- Size smaller when rank is extreme in either direction. Extremes tend to mean something is happening.
Pro Tip: Never let IV Rank replace a directional thesis. A stock can have a screaming-high IV Rank and still be a terrible short-premium candidate if you have no idea why volatility got that high. For strategy selection frameworks by market condition, our guide to options strategies for volatile markets and our rundown of low-risk options trades both walk through structure choices in more depth.
The step that matters most, and the one traders skip most often, is building an explicit bull case and bear case before the trade goes on. A high IV Rank tells you premium is rich. It says nothing about which direction the stock is likely to move, or whether the market has a legitimate reason to be nervous.
Where Does IV Rank Break Down? Lookback Traps and Regime Shifts
A single extreme event can distort IV Rank for months, sometimes the better part of a year, because that spike becomes the new denominator for every calculation until it finally rolls out of the 52-week window.
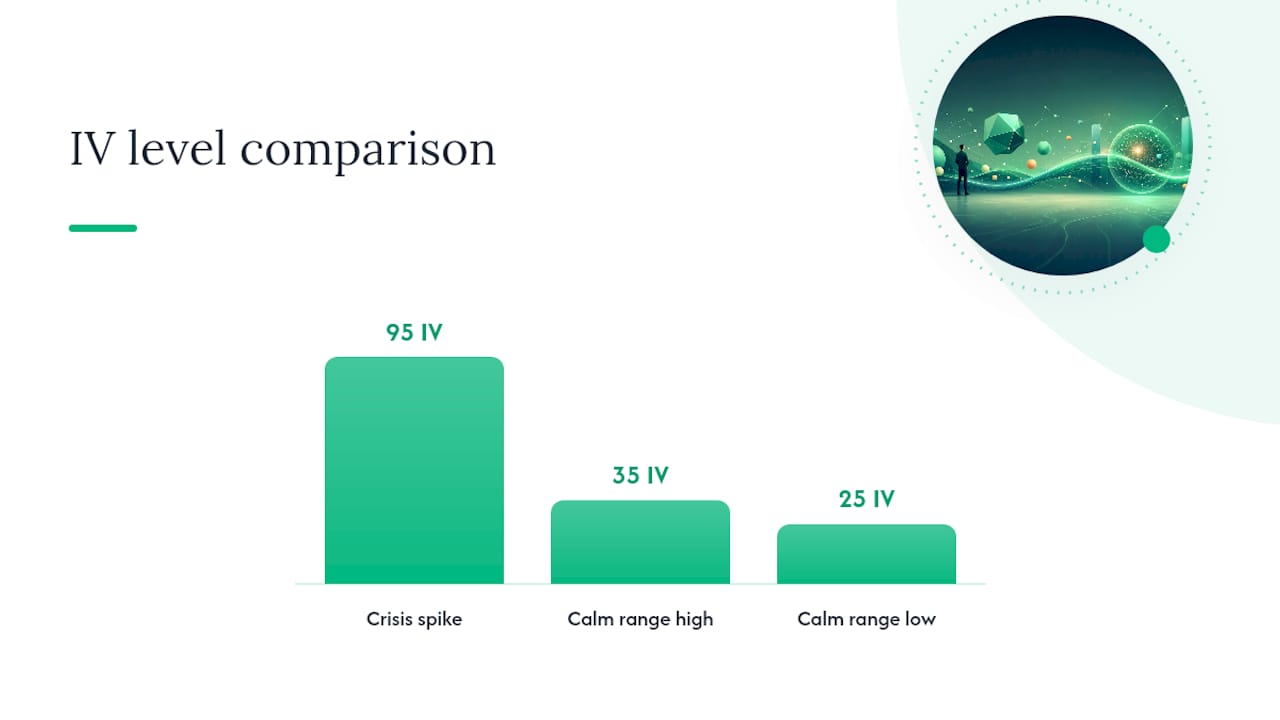
Consider a stock that spikes to an IV of 95 during a crisis, then spends the next ten months trading calmly between 25 and 35. Every single day during that calm stretch, IV Rank gets computed against that 95 high, making current readings look artificially low even though nothing about the stock's actual volatility regime is unusual anymore. Anyone screening for "low IV Rank means buy premium" during that window is working off a distorted number. ORATS' research on rank versus percentile divergence is built almost entirely around this exact failure mode.
Regime changes cause a related problem. If a company fundamentally changes, a new competitive threat, a sector-wide repricing, a change in growth trajectory, comparing today's IV to a year-old range may not be a meaningful comparison at all. The historical range reflects a company that, in some real sense, no longer exists in the same form.
Before trusting any single IV Rank reading, run this checklist:
- What lookback window is the platform using? Some default to 52 weeks; others let you customize to shorter or longer periods.
- Is there a known outlier event sitting inside that window, and how long until it rolls off?
- What does skew look like? Elevated rank concentrated in downside puts tells a different story than elevated rank spread evenly.
- Is liquidity thin enough that IV readings themselves are noisy or stale?
- Is the platform using intraday IV snapshots or end-of-day close values?
Our breakdown of different market condition types is useful background reading here, since regime context is exactly what a bare IV Rank number can't give you on its own.
How Often Does IV Rank Update, and Where Do Platforms Show It?
Most retail platforms and scanners recalculate IV Rank once per trading day, using closing implied volatility values rather than continuous intraday updates. That matters more than it sounds: a stock can gap sharply midday, and the IV Rank you see on your screen may still reflect yesterday's close until the next end-of-day recalculation.
Before trusting a number across different tools, verify three settings in your feed:
- Lookback window: confirm whether the platform defaults to 52 weeks or lets you adjust the window, since a 6-month lookback and a 2-year lookback on the same stock can produce meaningfully different ranks.
- Update timing: check whether extremes (the high and low used in the formula) get recalculated intraday or only after market close.
- IV series and tenor: confirm whether the number displayed is based on 30-day at-the-money IV, a full IV surface average, or another tenor entirely. Two platforms showing "IV Rank" for the same ticker can disagree if they're measuring different underlying IV series.
Comparing IV Rank across two platforms without checking these settings is comparing two different measurements wearing the same label.
How MorningOptions Uses IV Rank in Daily Trade Ideas
Some options research platforms treat IV Rank as one signal inside a broader scoring process, not a standalone trigger. Each trading day, an AI pipeline may cross-reference volatility readings against news catalysts, earnings proximity, liquidity, and technical setup before a trade idea gets ranked and surfaced in a morning briefing.
Some services provide free daily briefings with sets of ranked, specific contract ideas and entry levels before the market opens. Paid subscription tiers may add features like midday scanners that re-screen the market when conditions have shifted, plus AI chat scanners for researching individual tickers on demand. Every idea ships with a bear case alongside the bull case, because a rich or cheap IV Rank reading is only useful once you understand the actual risk on the other side of the trade. Traders should still confirm platform custody and safeguards independently through resources like FINRA and SIPC when choosing where to execute.
How Does IV Rank Compare to Historical Volatility and Raw IV Level?
IV Rank, historical volatility, and the raw implied volatility level all measure something related, but they're not interchangeable, and conflating them causes real mistakes.
Raw IV level is just the number itself, say, 35%. On its own, that figure tells you almost nothing, because 35% might be sky-high for a stable utility stock and unremarkable for a volatile biotech name. IV Rank fixes that by contextualizing the raw number against the stock's own history. That's the entire value proposition of rank: it converts an absolute number into a relative one specific to that underlying.
Historical volatility (sometimes called realized volatility) measures how much the stock actually moved in the past, based on price action, not options pricing. Implied volatility, by contrast, reflects what the options market expects going forward. Comparing the two tells you something IV Rank alone cannot: whether the options market is pricing in more movement than the stock has actually delivered recently. When implied volatility sits well above historical volatility, options are pricing in an above-normal expected move, sometimes justified by an upcoming event, sometimes simply because option sellers are demanding extra compensation for uncertainty.
A trader working all three together gets a fuller picture: IV Rank shows where current expectations sit relative to the past year, historical volatility shows what actually happened, and the gap between implied and historical volatility hints at whether the market is bracing for something specific. None of the three replaces the other two, and market analysis around shifting valuation stories, like the discussion in Lacuna Journal's piece on premium and changing valuation narratives, underscores how much of implied volatility is really a story about expectations rather than a fixed physical property of the stock.
What Does IV Rank Look Like Across Different Market Conditions?
The same IV Rank number means different things depending on the sector and the broader macro backdrop, which is exactly why context matters more than the raw score.
Take a mega-cap tech stock during a quiet, low-rate market. Its IV Rank might sit at 25, reflecting genuinely calm expectations with nothing unusual on the horizon. Now take that same reading, IV Rank of 25, on a small-cap biotech name a week before an FDA decision. That's not calm at all; it's likely an anomaly worth investigating, because binary catalysts almost always push IV higher, not lower, heading into the event. A low rank there might mean the lookback window's high point was an even bigger prior spike, distorting the current read.
Sector behavior matters too. Energy stocks tend to have structurally higher baseline volatility than consumer staples, so an IV Rank of 60 on an oil services name and a 60 on a grocery chain don't carry equal information; the oil name's absolute IV might be double the grocery chain's even at the same rank. Broader market regime plays a role as well. During periods of elevated macro uncertainty, like the kind of environment discussed in analyses of structural market valuation, individual stock IV Ranks can stay elevated across the board simply because index-level volatility is dragging everything up with it, not because any single name has unique risk.
The practical rule: always ask whether an IV Rank reading reflects something specific to the stock, or something happening to the whole market or sector around it.
How Should You Combine IV Rank With Option Greeks?
IV Rank tells you whether volatility is priced rich or cheap. It says nothing about how a specific position will actually behave, and that's where the Greeks come in.
Delta tells you directional exposure, how much your position moves per dollar move in the underlying. A high IV Rank might make you want to sell premium, but if you sell a strangle with deltas poorly matched to your actual market view, you've built a trade that fights your own thesis. Theta tells you how much time value you're collecting (if selling) or losing (if buying) each day, and it interacts directly with IV Rank: high-rank environments generally mean richer theta collection for sellers, while low-rank environments mean buyers pay less theta drag per day of exposure. Vega measures sensitivity to changes in implied volatility itself, arguably the most important Greek to watch alongside IV Rank, because a position with high positive vega in a high-IV-Rank environment is exposed to real losses if volatility mean-reverts even without the stock moving at all.
Gamma matters most near expiration and near the money, and it's worth checking regardless of what IV Rank shows, since gamma risk can dominate short-dated positions even when volatility itself looks calm. The practical workflow: use IV Rank to decide your bias (buy or sell premium), then use the Greeks to size and structure the specific position so its risk profile actually matches that bias. Our guide on defined-risk trade structures and the beginner strategy selection framework both walk through pairing volatility reads with Greek-based structure choices.
The Honest Take on IV Rank
Most guides oversell IV Rank as a signal when it's really a filter. The conventional advice, "sell when rank is above 50, buy when it's below 30", treats a relative measurement like a trading rule, and that's backwards. Rank tells you whether premium is expensive relative to that stock's own history. It says nothing about whether the stock's history is even a fair comparison anymore, and it says nothing about direction.
The single biggest mistake traders make isn't misreading the formula. It's skipping the step where they build an actual bull case and bear case before checking IV Rank at all. Volatility metrics should narrow your strategy choice after you already have a thesis, not generate the thesis for you. If you're sizing a trade purely off a rank number without an event calendar check and a real opinion on direction, you're not trading volatility. You're guessing with extra math attached.
Start with the story. Let IV Rank tell you how to price it.
— Customer
Sources
- Volatility: IV Metrics — Options Education Program
- Implied Volatility (IV) Rank & Percentile Explained — tastytrade
- IV Rank vs IV Percentile: A Complete Guide to Options Volatility — Barchart