
Earnings IV crush is the sharp drop in implied volatility that hits an option's price within minutes after a company reports earnings, stripping out the extra premium the market paid for uncertainty. Sellers of premium generally benefit; buyers of options, even correct-direction buyers, often lose money because falling volatility can outweigh the stock's move. The practical move is to check IV Rank and the expected move before you place any earnings trade.
TL;DR:
- Most implied volatility drops by 30% to 60% within minutes after earnings, driven by the resolution of uncertainty and market repricing.
- The sharpest vega loss occurs at-the-money options with short time to expiration, often leading to a significant decline in extrinsic premium.
- Effective strategies include selling defined-risk premium, using calendar spreads, and avoiding front-week options to mitigate IV crush impacts.
- Screening should prioritize high IV Rank, low realized-to-implied volatility gaps, and appropriate term structure signals to identify profitable setups.
- Diversification across multiple stocks and structures is essential, as even well-screened trades have a notable failure rate, and disciplined exit rules prevent overexposure.
Table of Contents
- What Causes IV Crush After Earnings?
- How Much Does IV Typically Drop After Earnings?
- Which Options Take the Biggest Hit From IV Crush?
- Strategies to Avoid or Profit From IV Crush
- Trade-Selection Checklist for IV Crush Setups
- Position Sizing and Risk Rules for Earnings Trades
- How Morningoptions Turns This Checklist Into a Daily Workflow
- Selling Premium Is a Probability Game, Not a One-Trade Bet
- Trade the Setup, Not the Guesswork
- Sources
- FAQ
What Causes IV Crush After Earnings?
Implied volatility is the market's guess at how much a stock will move, and it's baked into an option's extrinsic premium, the portion of the price that isn't intrinsic value. Around earnings, that guess balloons. Traders bid up options in the days and weeks before the report because nobody knows whether the number will beat, miss, or spook guidance, and that uncertainty has a price.
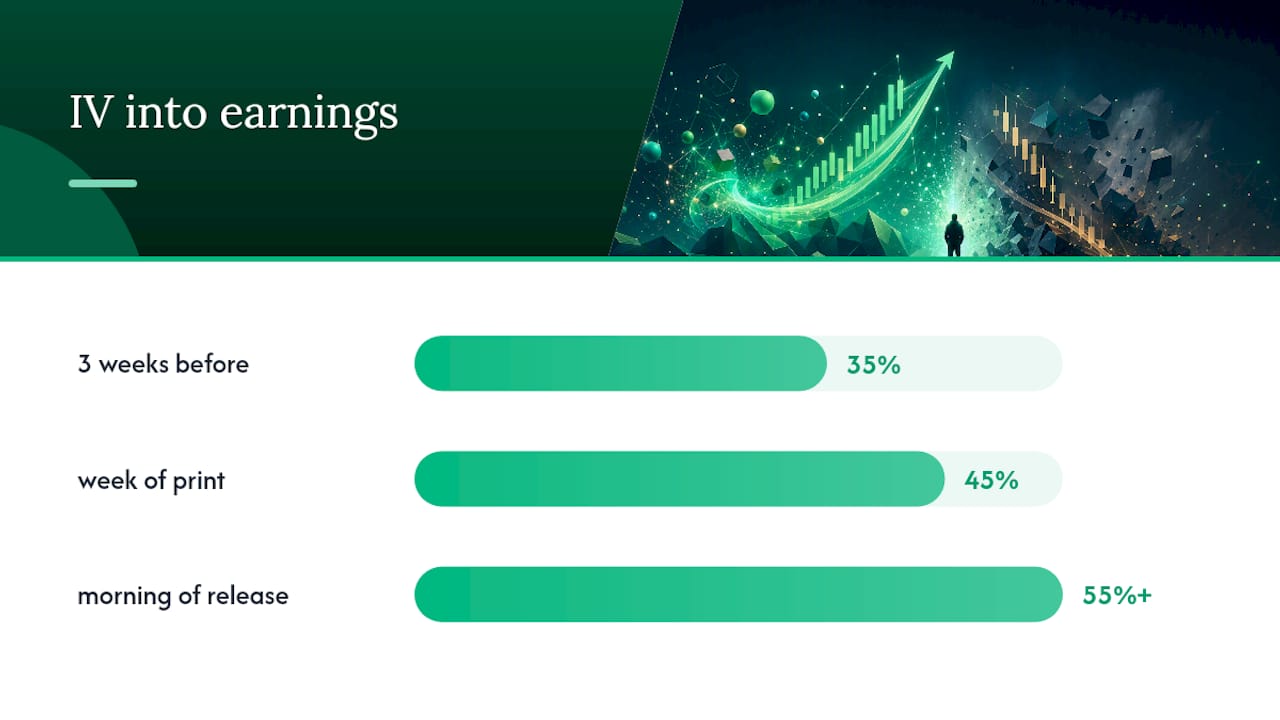
The ramp is gradual. IV on a name reporting in three weeks might sit at 35%, climb to 45% the week of the print, and hit 55% or higher the morning of the release. That climb reflects genuine unpredictability. The Options Industry Council documents this pattern clearly: implied volatility inflates ahead of the event and then collapses once the outcome is known.
The collapse itself is almost instant. Once the earnings press release hits the wire, or once the call ends, the uncertainty that inflated IV disappears. Options repricing happens within minutes of the print, often before the stock even finishes its initial move. This is the mechanic every earnings options trader needs to internalize: the market isn't waiting for the story to unfold over days. It reprices the moment the unknown becomes known.
The expected move, calculated from the at-the-money straddle price, is the market's own forecast of how far the stock will travel by expiration. If a $100 stock has a $6 at-the-money straddle, the market is pricing roughly a $6 move, up or down, as the breakeven zone for anyone buying that straddle. That number matters because it sets the hurdle. A stock that moves less than its expected move validates the crush thesis. A stock that moves more can still leave option buyers in the black, depending on how the Greeks interact.
A few mechanics worth keeping straight:
- Implied volatility reflects expected uncertainty, not direction.
- The ramp into earnings typically takes days to weeks; the crush usually takes minutes.
- The expected move (from the ATM straddle) is the market's built-in forecast for the reaction.
- Extrinsic premium, not intrinsic value, is what gets destroyed when IV collapses.
How Much Does IV Typically Drop After Earnings?
Most liquid, large-cap names see implied volatility fall by roughly 30% to 60% of its pre-earnings level once the report is out, according to data compiled by FlashAlpha. That's not a rare event. It's the expected outcome nearly every quarter, for nearly every optionable stock with a scheduled report.
By the numbers: A stock trading at 55% IV heading into its print might settle back to 25% to 35% within a day, a drop that can erase 15 to 25 absolute IV points even when the percentage move looks moderate.
Translating percentage drops into absolute IV points matters more than the headline number suggests. Vega, the Greek that measures an option's sensitivity to IV changes, cares about points, not percentages, so the raw math on higher-IV names hurts (or helps, for sellers) far more in dollar terms.
Sector matters too. Mega-cap tech names with deep liquidity and well-telegraphed guidance, think chipmakers and platform companies, tend to see moderate, predictable crushes because the market has priced them accurately over many cycles. High-beta growth stocks and small-cap biotech names behave differently. Utilities and other low-volatility sectors barely ramp IV at all before earnings, so there's little to crush.
The lesson for anyone building a earnings options strategy around volatility: the percentage drop headline is useful for screening, but the absolute point drop against your position's vega is what actually shows up in your account balance.
Which Options Take the Biggest Hit From IV Crush?
Not every option in a chain reacts the same way. Exposure to earnings volatility crush concentrates in a predictable place: at-the-money strikes with the least time to expiration.
Vega peaks at the money and decays as an option moves deep in or out of the money. Short-dated options carry higher vega per dollar of premium relative to their price than longer-dated ones, because nearly all of their value is extrinsic. Combine those two facts and you get the worst-case setup for IV crush exposure: an ATM option expiring the week of or the week after earnings.
Here's how the Greeks interact around the event:
- Vega drives the loss or gain from the IV collapse itself, independent of where the stock goes.
- Delta drives the gain or loss from the stock's actual price movement.
- Theta works against option buyers every day leading into the print, though it's usually a minor factor compared to the vega swing on report day.
- Gamma amplifies delta's effect near the money, but it can't rescue a position if vega loss outpaces it.
The comparison that decides whether a trade wins or loses is vega times the change in IV against delta times the change in stock price.
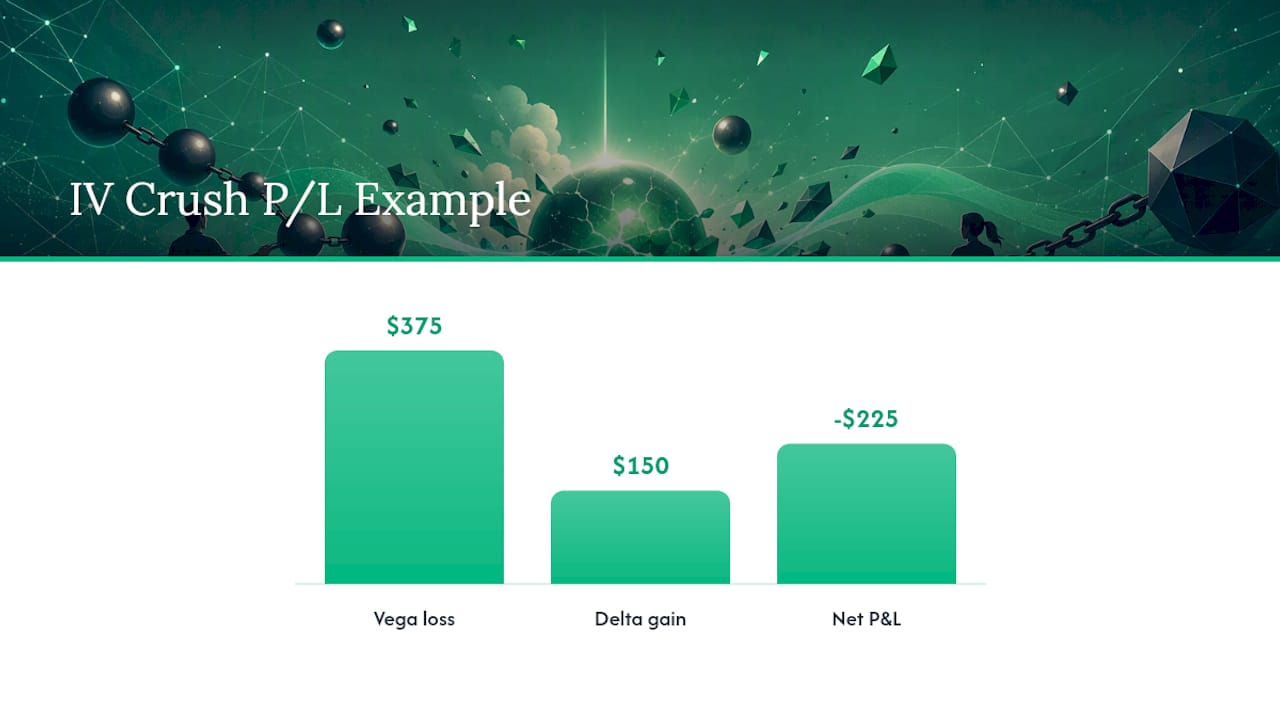
A worked example: Say you buy a call on a $100 stock ahead of earnings. The call has a delta of 0.50 and a vega of 0.15, meaning every 1 point of IV lost costs $15 per contract (vega is quoted per 1% IV change, per 100 shares). That's a vega loss of 25 × $15 = $375 per contract.
Now suppose the stock rallies $3 on the news, moving from $100 to $103. Your delta of 0.50 means you'd expect roughly $150 in gains from that move alone (ignoring gamma for simplicity). You were right about direction. You still lose money, because $150 in delta gain doesn't cover $375 in vega loss. Net result: roughly a $225 loss on a correct directional call. This is the exact scenario TradingBlock documents repeatedly with real option chains: being right about the stock and still losing the trade.
Quick math check: Vega loss ($375) minus delta gain ($150) equals a net loss of $225, even though the stock moved in the predicted direction.
The expected move sets the bar a buyer actually needs to clear. If the at-the-money straddle priced in a $6 move and the stock only moved $3, that's half the expected move, and the option chain already knew that outcome was plausible. The straddle price, and by extension every single-leg option built from it, gets marked down accordingly. Buyers need a move that exceeds the expected move by enough margin to overcome the vega hit. For a full walkthrough of the calculation, the expected move guide breaks down the straddle math step by step, and the options premium primer covers how extrinsic value gets priced in the first place.
Strategies to Avoid or Profit From IV Crush
Once you understand that IV crush is baked into every earnings report on the calendar, the question shifts from "will this happen" to "how do I position for it." There are two broad camps: sellers who want to harvest the crush, and buyers who need to sidestep it or find a structure where it doesn't matter as much.
Selling premium into earnings is the most direct way to trade IV crush. Iron condors, credit spreads, and out-of-the-money strangles all collect elevated premium before the report and benefit when that premium deflates. An iron condor sells both a call spread and a put spread around the expected move, capping risk on both sides while still capturing most of the vega collapse if the stock stays within its range.
Defined-risk structures beat naked short straddles for a simple reason: a naked short straddle has theoretically unlimited risk on the call side and substantial risk on the put side if the stock gaps hard against you. An iron condor caps that loss at the width of your spread less the credit received. Given that even careful earnings screens are wrong some of the time, defined risk isn't optional if you're planning to do this repeatedly across many names and many quarters.
Calendar and diagonal spreads offer a more surgical approach. Selling the front-month option (which carries the inflated pre-earnings IV) and buying a longer-dated option at the same or a nearby strike isolates the crush in the front leg while the back leg retains more of its value. If front-month IV is trading meaningfully above back-month IV, a state known as term-structure backwardation, that's a strong confirming signal the market has priced a specific event into the near expiration.
Buyer tactics require more discipline than seller tactics, because buyers are fighting the crush instead of riding it. A few rules help:
- Avoid buying front-week, at-the-money options purely to bet on earnings direction; that's the exact profile that suffers the worst vega loss.
- If you want directional exposure through the report, consider a longer-dated option (60 or more days out) where vega per dollar of premium is lower and the crush affects a smaller share of the total price.
- Alternatively, buy well before the IV ramp begins, when implied volatility is still near its baseline, and exit into the ramp rather than holding through the print.
- Debit spreads reduce net vega exposure compared to outright long calls or puts, since the short leg partially offsets the long leg's IV sensitivity.
Index versus single-stock plays deserve a specific mention. Broad index products like SPX or SPY don't experience earnings-driven IV crush the way individual stocks do, because no single company's report moves the index enough to justify a comparable volatility ramp. Traders who want volatility exposure around a broad market event, a Fed decision or a jobs report, often prefer index options precisely because the crush dynamics are milder and more predictable than single-name earnings volatility.
A trader comfortable selling premium might sell an iron condor with short strikes just outside that 7% expected move, sized so the maximum loss is under 2% of account equity, and plan to close the position the morning after the report regardless of outcome, locking in the crush rather than holding for further theta decay.
Pro Tip: Set your exit rule before you place the trade, not after you see the print. Decide now whether you're closing the morning after earnings regardless of profit or loss. Deciding in real time, with a red or green number staring back at you, is how disciplined plans fall apart.
Trade-Selection Checklist for IV Crush Setups
A repeatable process beats a hot tip every time, especially across dozens of earnings events per quarter. Here's the screening sequence worth running on any candidate before you commit capital.
- Check IV Rank first. IV Rank measures where current implied volatility sits relative to its own 52-week range, and a reading above 50 generally signals the options are pricing in enough uncertainty to make selling premium worthwhile. OptionsTradingIQ recommends this threshold as a baseline screen precisely because low IV Rank environments don't leave much room for a crush trade to profit. The IV Rank guide walks through the exact calculation if you want to build your own screen.
- Compare ATM implied volatility to recent realized volatility. The gap between the two is the volatility risk premium, essentially what you're being paid to sell. A wide gap suggests the market is overpricing the coming move relative to how the stock has actually behaved.
- Pull the last four to eight earnings cycles and compare the stock's actual post-earnings move to what the straddle priced in each time. A stock that consistently moves less than its expected move is a stronger candidate for premium selling than one that regularly blows through it.
- Check the term structure. Front-month IV trading well above back-month IV, the backwardation pattern, confirms the market has concentrated event risk in the near expiration, which is exactly what a calendar spread or short front-month structure wants to see.
- Look at skew. Steep put skew relative to calls can signal the market is pricing in more downside tail risk, which should influence how you structure your short strikes on an iron condor.
- Record your pre-trade data points — IV Rank, expected move, historical realized move, and term structure — so you can review win rates and refine the screen over time instead of relying on memory.
This isn't a one-time exercise. Running the same six checks every earnings season, on the same watchlist, is what turns a decent idea into a process you can actually trust across a full quarter of trades.
Position Sizing and Risk Rules for Earnings Trades
The math around earnings IV crush favors sellers on average, but averages don't protect you from a single bad quarter if you're oversized. Selling premium into earnings has historically won a majority of the time, with some estimates from ApexVol putting the win rate around 70% to 80% for well-screened setups, but that also means a meaningful share of trades go against you, sometimes badly, when a stock gaps far outside its expected move.
Size to your worst-case loss, not your expected loss. That way, even a full loss on one name doesn't meaningfully dent your capital.
A few standing rules worth adopting:
- Favor defined-risk structures over naked short options for earnings trades; the tail risk on an uncapped short straddle isn't worth the extra premium.
- Spread your earnings trades across multiple names and expiration cycles rather than concentrating capital in one or two "best" setups each week.
- Set adjustment triggers in advance: know at what point you'll roll a threatened short strike, add a hedge, or simply accept the max loss and move on.
- Watch assignment risk on short strikes that go in the money, particularly around dividend dates, since early assignment can change your position overnight.
Pro Tip: Diversification across earnings trades works differently than diversification across a long-term portfolio. You're not just spreading market risk, you're spreading idiosyncratic event risk, so five small positions across five unrelated sectors beat one large position in your highest-conviction name.
Margin requirements and tax treatment on short options vary by broker and account type, and short-term gains on premium-selling strategies are typically taxed at ordinary income rates, so it's worth reviewing your specific account's margin rules and consulting a tax professional before scaling up a systematic earnings-selling approach. The options strategy guide for volatile markets covers additional structure choices if you're building out a broader playbook beyond earnings season.
How Morningoptions Turns This Checklist Into a Daily Workflow
Running the IV Rank, expected-move, and term-structure checks above manually across dozens of tickers every earnings season takes real time, time most active traders don't have before the market opens. A service builds daily briefings using an AI pipeline that vets, scores, and ranks trade ideas, pulling in the same categories of signal covered in the checklist section: volatility context, catalyst timing, and defined-risk structure fit.
Each morning briefing includes specific contract ideas with entry levels and a bear case, not vague commentary about "elevated volatility." That format maps directly onto the screening process outlined above: instead of running IV Rank and term-structure checks yourself across a watchlist, you get a ranked, pre-screened shortlist before the opening bell. Subscribers may also get a lunchtime scanner and an AI chat tool for researching individual tickers on demand, useful for confirming an earnings candidate against your own checklist before sizing a position.
Selling Premium Is a Probability Game, Not a One-Trade Bet
Treat earnings IV crush the way a casino treats its house edge: real, statistically reliable, and still capable of losing on any single hand. The traders who do this well aren't the ones who nail every earnings call. They're the ones who size small enough that one bad gap doesn't matter, then repeat the process across dozens of names every quarter.
I lean toward index and diversified single-stock exposure over concentrated bets on one "sure thing" ticker, because a single biotech blowup can undo months of steady premium collection. Diversification across names and expirations isn't a hedge against being wrong. It's an acknowledgment that even a well-screened setup fails a meaningful share of the time, and that's fine, as long as no single failure threatens the account.
— Customer
Trade the Setup, Not the Guesswork
Morningoptions gives you the screening work this article walks through, done every trading morning before the bell. The free daily briefing delivers ranked trade ideas with entry levels and a bear case, the same categories of signal (IV context, catalyst timing, expected-move fit) that separate a good earnings premium sale from a coin flip.

The free plan gets you the daily briefing itself: specific setups, not generic market notes. The Pro plan, at $89 a month or $742 a year, adds the lunchtime scanner for midday moves and an AI chat scanner so you can research any ticker on demand, run your own IV Rank and term-structure check against a name that catches your eye, and confirm it fits before you size a position. If you're screening earnings trades regularly enough that the checklist in this guide is starting to feel like a part-time job, see what Morningoptions covers and decide whether the Pro workflow fits your routine.
Sources
- The Crush Is Real
- IV Crush Explained - What Happens to Options After Earnings (With Data) | FlashAlpha
- IV Crush Strategy: How to Systematically Profit as an Income Trader
- IV Crush in Options: Bad for Buyers, Great for Sellers | TradingBlock
FAQ
How Much Does IV Drop After Earnings?
Implied volatility typically falls by roughly 30% to 60% of its pre-earnings level within minutes of the report, according to FlashAlpha's analysis of post-earnings option chains. The exact size depends on the stock's sector, how elevated IV got before the print, and how close the actual move landed to the expected move.
What Causes IV Crush?
IV crush happens because the uncertainty that inflated an option's premium disappears the moment earnings results become known. Once the unknown outcome is resolved, the market has no reason to keep pricing in extra risk, so implied volatility collapses and takes extrinsic premium down with it.
Can Implied Volatility Go Up After Earnings?
It's uncommon but possible, usually when the earnings report itself raises new uncertainty rather than resolving it, such as unexpected guidance changes, a pending merger announcement, or a follow-up catalyst still ahead. In the large majority of routine earnings cases, IV falls rather than rises once the print is out.
What Does "Implied Volatility Crush" Mean?
Implied volatility crush describes the rapid decline in an option's implied volatility, and therefore its extrinsic premium, right after a scheduled event like earnings resolves the uncertainty that inflated it. It matters because it can cause an option buyer to lose money even when the stock moves in the direction they predicted, since vega loss can outweigh delta gain.
Is Selling Options Before Earnings a Reliable Strategy?
Selling premium before earnings has a favorable historical win rate for well-screened setups, with some estimates from ApexVol citing roughly 70% to 80%, but it still carries real tail risk on any individual trade. Defined-risk structures like iron condors and credit spreads, sized to a small percentage of account equity, are the standard way to keep that tail risk manageable while capturing the crush.