
An options trade score is a composite 0–100 index that ranks contract quality across multiple inputs — it is not a win probability. Think of it as a compressed signal: one number that reflects how well a specific contract scores on liquidity, yield, implied volatility, probability of profit (POP), and cushion, all adjusted for days-to-expiration (DTE) and minimum premium quality. The score tells you whether a contract is worth a closer look, not whether it will make money.
Here is the one-paragraph rule: use the score to build a shortlist, then run a manual vet before touching capital. A high score is an invitation to investigate, not a green light to execute. Trading scanners automate the shortlist step; the manual vet is yours to run.
Quick-start checklist:
-
- Shortlist any contract scoring in the top band (typically 70+ on a 0–100 scale)
- Run a hard-floor liquidity check regardless of score: open interest, bid/ask spread, and volume
- Confirm implied volatility (IV) regime fits your strategy (selling in elevated IV, buying in crushed IV)
- Check POP against your risk tolerance — POP is a model output, not a historical win rate
- Do a manual vet before allocating capital: catalyst calendar, portfolio fit, position size
Key Takeaways
Interpreting options trade scores correctly means using them as a shortlist filter, running hard-floor checks every time, and grading your execution separately from the score's prediction.
| Point | Details |
|---|---|
| Scores rank quality, not probability | A 0–100 composite ranks contract quality across inputs; it is not a win-rate prediction. |
| Hard floors override high scores | Liquidity failure, missing premium, or absent edge vetoes a trade regardless of composite score. |
| POP is a model output | Probability of profit reflects current pricing assumptions, not historical win rates — treat it accordingly. |
| Size to confidence level | Full-confidence trades get standard size; marginal scores or soft-floor concerns get half size or a pass. |
| Morningoptions pre-scores daily | Morningoptions delivers ranked, scored contract ideas with entry levels and rationale every morning before the open. |
Table of Contents
- What metrics actually feed an options trade score?
- Interpreting each metric: what it measures and how it moves your decision
- What trade scores don't tell you and common mistakes to avoid
- A 60–180 second pre-trade workflow for acting on a score
- A worked example: reading one scored trade from top to bottom
- How scoring models are built: a transparent 5-pipeline example
- Morningoptions gives you pre-scored trade ideas with the explainers built in
- How experienced traders actually use scores in practice
- Sources
What metrics actually feed an options trade score?
Most scoring systems pull from the same pool of market data. Open interest, volume, and implied volatility are the core inputs available from exchange feeds and analytics platforms, used as liquidity and sentiment signals. Here is a quick inventory of what you will see inside most scores:
Liquidity inputs: open interest (standing contracts), daily volume (fresh activity), and bid/ask spread (execution cost proxy).
Volatility inputs: implied volatility (IV), IV rank or IV percentile (where current IV sits relative to its own history), and IV skew (the difference in IV between puts and calls at different strikes).
Probability inputs: POP (probability of profit), Prob ITM (probability the option expires in the money), and probability of touch (probability the underlying hits the strike at any point before expiration).
Structural inputs: expected move (the market's priced-in range for the underlying over the option's life), DTE (days to expiration), and premium quality (the bid relative to the strike price).
The Greeks: delta (directional sensitivity), gamma (rate of delta change), vega (sensitivity to IV changes), and theta (daily time decay).
Order-flow inputs: Gamma Exposure (GEX) and Delta Exposure (DEX), which reflect aggregate dealer positioning and can signal where the market may pin or repel.
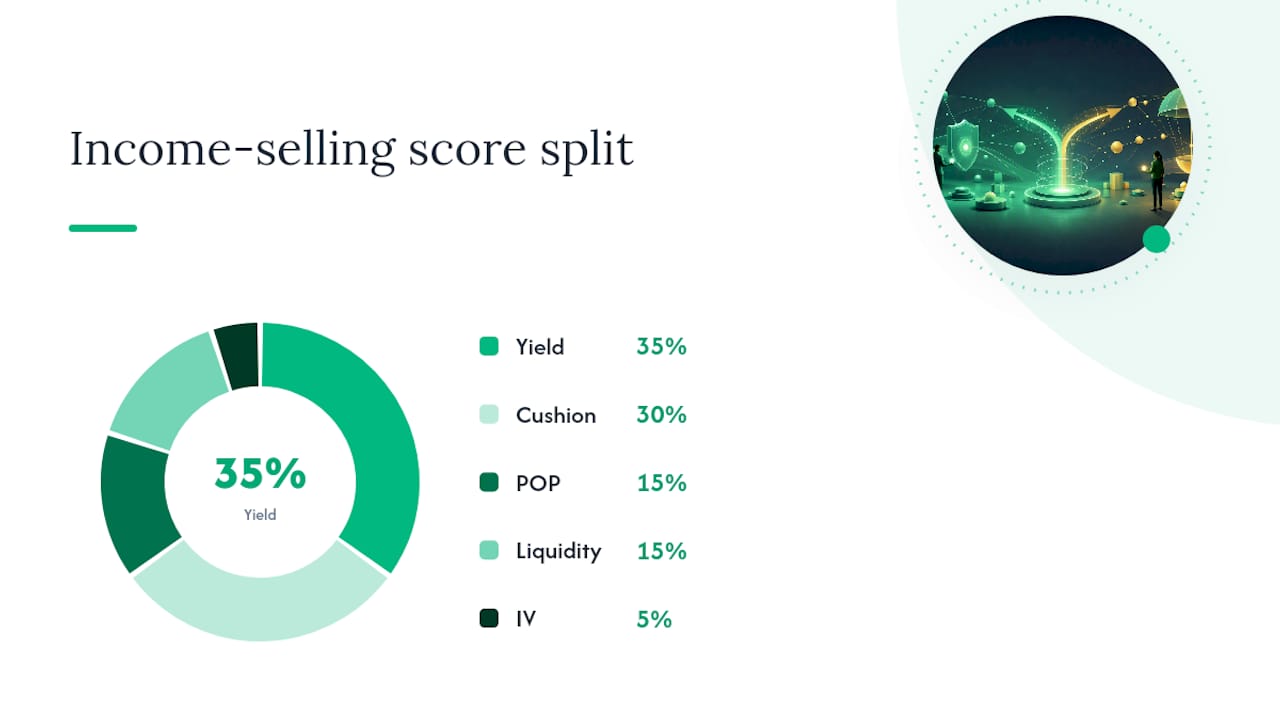
Statistic callout: A 0–100 contract score built for income-selling strategies typically weights yield at roughly 35%, cushion at 30%, POP at 15%, liquidity at 15%, and IV at 5% — with DTE multipliers favoring the 14–45 day window. Directional or defined-risk models shift weight toward delta, expected move, and IV skew instead.
Some systems produce sub-scores first — a liquidity sub-score, a yield sub-score, a cushion sub-score — and then blend those into the final composite. That layered structure matters when you are trying to understand why a score is high or low.
Interpreting each metric: what it measures and how it moves your decision
Open interest and volume
Open interest shows how many contracts are currently outstanding. Low OI means thin liquidity: you may struggle to fill at a fair price, and exits can be punishing. Volume shows fresh activity on a given day. A contract with high OI but low daily volume is stale; high volume on low OI can signal a one-day spike that disappears tomorrow.

Practical threshold: for most retail trades, look for OI above 500 contracts and a bid/ask spread under $0.10 on lower-priced underlyings, tighter on higher-priced ones.
Implied volatility and IV skew
IV measures the market's expectation of future price movement, priced into the option premium. High IV means expensive options — favorable for sellers, risky for buyers. IV rank (IVR) contextualizes current IV against the past 52 weeks: an IVR above 50 generally favors selling strategies; below 30 often favors buying.
IV skew tells you whether puts or calls carry a premium. A steep put skew (puts more expensive than calls at equivalent distance) signals downside fear in the market. For a cash-secured put seller, steep skew means richer premium but also a market that is pricing in real downside risk.
Pro Tip: When IV rank is above 50 and you are considering a short put, check the skew first. Steep skew can inflate POP numbers because the model prices puts richly — your actual cushion may be thinner than the score suggests.
Probability metrics: POP, Prob ITM, and probability of touch
POP is the model's estimate of the probability that a trade closes profitably. Prob ITM is the probability the option expires in the money. Probability of touch is higher than Prob ITM because it counts any breach of the strike, not just expiration.
None of these are historical win rates. They are outputs of a pricing model (usually Black-Scholes or a variant), and they shift as IV, time, and price move. A 70% POP does not mean you will win 70 out of 100 trades — it means the model, at this moment, prices the contract that way.
Expected move
The expected move is the market's priced-in range for the underlying over the option's life, derived from the at-the-money straddle price. It gives you a quick reference for where to place strikes. A short put at 1x expected move below spot is roughly at the 1-standard-deviation level; 1.5x is more conservative.
The Greeks
Delta tells you how much the option's price moves per $1 move in the underlying. A delta of 0.30 on a short put means the option gains $0.30 in value (against you) for every $1 drop in the stock. For income sellers, lower delta (0.15–0.30) means less directional exposure.
Gamma is the rate at which delta changes. High gamma near expiration means your delta can shift fast — a small move in the underlying creates a large change in your position's risk profile. Short-dated options carry high gamma risk.
Vega measures sensitivity to IV changes. Long options benefit from rising IV; short options get hurt. If you are short a put and IV spikes (common in sell-offs), vega works against you even if the underlying barely moves.
Theta is your daily time-decay income on a short option. Theta accelerates as expiration approaches, which is why income sellers often prefer the 21–45 DTE window — theta is meaningful but gamma risk is still manageable.
GEX and DEX
Gamma Exposure (GEX) and Delta Exposure (DEX) reflect aggregate dealer hedging positions. Positive GEX near a strike suggests dealers are long gamma and will buy dips / sell rips, creating a pinning effect. Negative GEX can amplify moves. These are useful as a macro filter — if GEX signals a pin at a level near your short strike, that is a mild tailwind. They are not precise enough to trade alone. For more on options sentiment signals, the mechanics behind order-flow indicators are worth understanding separately.
Metric-to-action mapping
| Metric | Primary trade risk/benefit | Immediate trader action |
|---|---|---|
| Open interest (low) | Execution risk, wide fills | Skip or size down significantly |
| IV rank (high, >50) | Rich premium for sellers | Favor short strategies; check skew |
| IV rank (low, <30) | Cheap options for buyers | Favor long or debit strategies |
| POP (>70%) | High model probability | Confirm with manual cushion check |
| Theta (high) | Fast time decay income | Verify DTE is in 21–45 day window |
| Gamma (high) | Rapid delta shift near expiry | Avoid short-dated short options |
| Vega (high) | IV-change sensitivity | Size down if earnings are near |
| GEX (positive at strike) | Pinning tendency | Mild tailwind for short strike |
| Bid/ask spread (wide) | Execution cost eats edge | Hard floor: reject if spread >10% of mid |
Minimum premium quality: scoring systems often apply a hard floor based on the bid relative to the strike price. A $0.05 bid on a $200 stock is nearly worthless as a premium — the cushion and yield metrics become unreliable. Minimum-bid thresholds by stock-price band step a contract's score down when the premium is too small relative to the strike, preventing tiny-bid contracts from scoring artificially high on cushion or POP.
**
What trade scores don't tell you and common mistakes to avoid
Scores are powerful filters. They are also easy to misread. Here are the pitfalls that cost traders money:
-
Reading the score as a win probability. A score of 85 does not mean an 85% chance of profit. It means the contract ranks well across its composite inputs at this moment. The score can drop to 40 by tomorrow if IV collapses or the bid evaporates.
-
Comparing scores across dissimilar tickers. An 80 on a liquid large-cap and an 80 on a thinly traded small-cap are not equivalent. Liquidity, spread, and volatility regime make the same numeric score mean very different execution risk. Always check the underlying's OI and spread before treating scores as cross-ticker rankings.
-
Ignoring hard floors. A scorecard that enforces hard floors treats liquidity failures, missing premium, and absent edge as immediate NO-TRADE gates — regardless of the composite score. If a contract fails a hard floor, the score is irrelevant. This is not a suggestion; it is the rule that prevents high scores from masking unexecutable contracts.
-
Thin-data damping effects. Scoring systems that incorporate trader performance history apply pull-to-neutral damping when closed-trade samples are small. A score built on 5 closed trades is far less reliable than one built on 50. Confidence labels or sample-size indicators tell you how much to trust the score's signal strength.
-
Win-rate illusion. Trader Score frameworks intentionally weight win rate as a small input because win rate alone is misleading. A 70% win rate with poor risk-reward can destroy an account. Scores that weight risk discipline and profit factor more heavily give a more honest picture of edge.
-
Catalyst blindness. Scores built on current market data do not know an earnings announcement drops tomorrow. IV can spike, bids can vanish, and the expected move can double overnight. Always cross-check the catalyst calendar before acting on any score during earnings season.
A 60–180 second pre-trade workflow for acting on a score
This is the sequence experienced traders run after a score flags a candidate. It takes under three minutes when you know what you are looking for. For a more detailed trade vetting process, the steps below map directly to a full manual review.
-
Score band check. Is the score in the top band (70+ on a 0–100 scale)? If not, pass immediately. Do not rationalize a 55 into a trade.
-
Hard-floor liquidity check. Open interest above 500, bid/ask spread under 10% of mid, daily volume confirming the market is active. Fail any one of these and the trade is dead regardless of score.
-
Minimum premium check. Is the bid meaningful relative to the strike? For stocks under $50, a minimum bid of $0.15–$0.20 is a reasonable floor. For stocks $50–$150, $0.25–$0.40. Above $150, $0.50+. These are guidelines, not rules carved in stone — adjust for your own cost-of-capital threshold.
-
IV/POP sanity check. Does IV rank support your strategy direction? Is POP above your minimum threshold (many income sellers use 65–70% as a floor)? If IV rank is below 30 and you are considering a short put, the premium may not justify the risk.
-
Catalyst calendar check. Any earnings, FDA decisions, or macro events before expiration? If yes, either pass or size down to half your normal position.
-
Portfolio fit check. Does this trade add correlated risk you already have? If you are already short puts on three tech names, a fourth may concentrate sector exposure beyond your plan.
-
Position sizing. A full-confidence trade (high score, all floors pass, clean catalyst window) gets your standard size. A marginal score or one soft-floor concern gets half size. Two soft-floor concerns: pass.
-
Order plan. Set your entry (limit at mid or slight discount), your profit target (typically 50% of max premium for income trades), and your stop or adjustment trigger (typically 2x premium received or delta breach).
-
Log the trade. Record the score, the sub-scores you checked, and your rationale. This is the raw material for improving your screening process over time.
Pro Tip: Set a hard rule: if you cannot complete steps 1–5 in under 90 seconds, the trade is not ready. Hesitation usually means a missing piece of information — find it or pass.
A worked example: reading one scored trade from top to bottom
Here is a hypothetical trade to show the full process in action.
Setup: Stock XYZ trades at $148. You are evaluating a 30-DTE cash-secured put at the $135 strike, bid at $0.85. The platform displays a composite score of 78/100.
Decision log:
- Score band: 78 passes the 70+ threshold. Candidate confirmed.
- Hard-floor liquidity: OI of 2,400 and a $0.04 spread. Clean pass.
- Minimum premium: $0.85 bid on a $148 stock. Passes the $0.50+ floor for this price band.
- IV/POP sanity: IV rank at 54% supports a short strategy. POP sub-score of 71 is above the 65% floor.
- Catalyst check: no earnings in the next 35 days. Clean window.
- Portfolio fit: no other short puts on this sector. Full-size trade.
- Position size: standard allocation (e.g., 1 contract per $13,500 of capital reserved).
- Order plan: limit order at $0.83 (slight discount to mid), profit target at $0.42 (50% of premium), adjustment trigger if XYZ drops below $140 before day 15.
What would change this decision:
- Earnings announced for day 25: size drops to half, or pass entirely if IV spike makes the risk/reward unattractive.
- Bid drops to $0.30 at open: hard-floor minimum premium fails. Pass.
- OI drops below 200 overnight: liquidity floor fails. Pass.
**
For more defined-risk trade examples that show how cushion and premium interact with score components, the patterns repeat across different strategy types.
How scoring models are built: a transparent 5-pipeline example
Scores are weighted blends of normalized sub-metrics plus sanity multipliers (DTE, premium quality), then clamped to a display range. Understanding the pipeline helps you audit a score rather than just accept it.
A well-built scoring model does not hide its logic. It tells you which inputs it weights, how it handles thin data, and where it applies multipliers. If a scoring system cannot explain why a contract scored 78 versus 62, it is a black box — and black boxes are not tools, they are guesses dressed up in numbers.
Here is how a 5-pipeline model works, modeled on the kind of transparent methodology Morningoptions applies to its daily briefings:
-
Pipeline 1 — Data ingestion: Pull live exchange quotes, IV surface, volume, OI, and bid/ask data. Flag any contract where data is stale or missing. Stale data triggers a score suppression flag.
-
Pipeline 2 — Normalization: Convert raw metrics to percentile ranks within the current universe of candidates. A $0.85 bid means nothing without knowing whether that is high or low for this strike/DTE combination. Normalization makes metrics comparable.
-
Pipeline 3 — Sub-score calculation: Compute sub-scores for yield, cushion, POP, liquidity, and IV using the normalized inputs. For income-selling models, yield carries roughly 35% weight, cushion 30%, POP 15%, liquidity 15%, and IV 5%. Directional models shift weight toward delta and expected move.
-
Pipeline 4 — DTE and premium-quality multipliers: Apply a DTE multiplier that favors the 14–45 day window (peak theta efficiency) and a premium-quality multiplier that steps down contracts with bids too small relative to the strike. These multipliers can reduce a strong sub-score composite by 10–20 points if the contract is outside the preferred window.
-
Pipeline 5 — Clamping and rounding: Clamp the raw composite to the 0–100 display range and round to the nearest integer. Apply pull-to-neutral damping for thin-data situations — when sample sizes are small, scores are pulled toward a neutral baseline to prevent single outliers from producing misleadingly high or low readings.
Trust signals to look for in any scoring system:
- Named data sources (exchange quotes, IV surface providers, volume/OI feeds)
- Explicit component weights or at least weight-category disclosures
- Confidence labels or sample-size indicators alongside scores
- Backtest notes showing how scores correlated with subsequent outcomes
- Hard-floor documentation: what fails a contract before the composite is even calculated
The options scoring models guide on Morningoptions's blog walks through how different model architectures handle these pipeline decisions and where they diverge.
Morningoptions gives you pre-scored trade ideas with the explainers built in
Every morning before the open, Morningoptions runs its 5-pipeline AI scanner across the options universe and delivers a ranked list of specific contract ideas — not vague market commentary, but named tickers, strikes, expiration dates, and entry levels, each with a score and a short rationale explaining which metrics drove the ranking.

The free daily briefing gives you a sample of the day's top-ranked ideas. The Pro tier ($89/month) unlocks the full ranked list, the lunchtime scanner, and the Signal Lab — an AI chat interface where you can research any ticker on demand and get a scored analysis in seconds. If you have been running the pre-trade workflow in this article manually, Signal Lab does the shortlist step for you, so your 90 seconds goes entirely to the manual vet.
Start with a free briefing at Morningoptions and see how scored, ranked trade ideas fit into your existing process.
How experienced traders actually use scores in practice
Scores work best as a diagnostic sieve, not a trading system. The workflow is: score flags a candidate, manual vet confirms or kills it, execution follows the plan. That sequence matters because it keeps the score in its proper role.
Experienced traders tend to follow a few norms that separate them from traders who over-rely on scores. They treat a high score as permission to spend 90 seconds looking harder, not as a signal to buy. They dismiss low scores quickly without second-guessing the filter. And they grade their own execution quality separately from whether the score was right — because a well-executed trade on a high-score candidate that loses money is still a good process decision, while a sloppily entered trade on a high score that happens to win is a lucky outcome, not a skill signal.
The A/B/C trade-quality grading framework makes this concrete: an A-grade trade follows the full process (score check, hard floors, manual vet, proper sizing, logged entry). A C-grade trade skips steps because the trader "had a feeling." Over time, converting C trades to A trades tends to improve long-term expectancy even when individual A trades lose.
Journaling closes the loop. Log the score, the sub-scores you checked, your rationale, and the outcome. After 30–50 trades, patterns emerge: maybe your liquidity floor is too loose, or your IV rank threshold is too aggressive. Tracking options trades systematically gives you the data to tune your screening criteria rather than guessing at what to change.
Sources
- Understanding Contract Score: How Our 0–100 Rating Works | Wheel Strategy Options Screener Guide
- Trade Quality Score: Grade Every Trade A, B, or C
- What Is a Trader Score? Complete Guide | Profit AI
- Tradeways Score | Tradeways Docs
- Today's Stock Option Quotes and Volatility
This article is general information, not a substitute for advice from a qualified financial advisor. Consult a qualified financial professional about your own circumstances before acting on anything here.