
Options chain analysis means reading strikes, open interest, implied volatility, and Greeks together to find where real positioning sits, not just where prices happen to be. The first move when a chain loads is simple: scan for strikes where open interest is piling up alongside a spike in implied volatility. Those two signals, checked together, tell you where the market is placing its bets. A workflow like this automates that first scan every morning before the open.
TL;DR:
- Heavy open interest and implied volatility spikes at specific strikes suggest strong market conviction and potential entry points for trades.
- Analyzing the change in open interest alongside price movement reveals whether traders are building new positions or unwinding existing ones.
- Using probability of profit and expected move estimates helps size positions appropriately, but these are only probabilistic guides, not certainties.
- Automated tools and daily briefings can significantly streamline the morning workflow, providing ranked ideas and key risk considerations without manual analysis.
- Monitoring intraday open interest shifts and bid/ask spreads is vital to avoiding illiquid strikes and ensuring efficient trade exits.
Table of Contents
- What Does an Options Chain Actually Show You?
- Reading Every Field: Bid/Ask, Volume, Open Interest, IV, and the Greeks
- How Do You Turn Chain Data Into a Ranked Trade Idea?
- What Do Implied Probabilities From an Options Chain Really Mean?
- Which Tools Actually Speed Up Chain Analysis?
- How Morningoptions Runs This Checklist Every Morning
- What I've Learned Watching Chains Every Morning
- Get Ranked Trade Ideas Before the Bell
- Sources
What Does an Options Chain Actually Show You?
An options chain is a grid. Rows represent strike prices; columns split into calls on one side and puts on the other, with a separate table for each expiration date. Read left to right, and you're looking at the same strike priced two different ways depending on direction.
The numeric columns that matter most for options chain analysis are:
- Bid/ask: the buy and sell prices market makers are quoting right now
- Last: the most recent traded price, which can lag the current bid/ask
- Volume: contracts traded that session
- Open interest (OI): total contracts still outstanding, unexpired
- Implied volatility (IV): the market's forward guess at price swings
Most platforms let you toggle between a standard view, a Greeks view (adding delta, gamma, theta, vega as columns), and a detailed view that layers in IV rank or historical comparisons. Switching expirations usually means clicking a dropdown or a separate tab above the grid. Get comfortable jumping between weekly and monthly expirations early, because strike behavior often differs sharply between the two.
Reading Every Field: Bid/Ask, Volume, Open Interest, IV, and the Greeks
Every column on the chain has a job. Here's the quick reference:
- Bid/ask spread: The gap between what buyers offer and sellers demand. A spread under 5% of the option's price usually signals healthy liquidity. A spread wider than 10 to 15% is a red flag, and trading into it often means giving up an immediate edge to the market maker.
- Volume vs. open interest: Volume resets to zero each session. Open interest doesn't. A single large volume print means someone traded, but it's the change in open interest the next day that tells you whether that trade opened a new position or closed an old one.
- Implied volatility and skew: IV reflects how much movement the market is pricing in. When puts carry noticeably higher IV than calls at equivalent distances from the current price, that's skew, and it usually signals the market is paying up for downside protection.
- The Greeks cheat sheet: Delta estimates directional exposure and rough probability of finishing in the money. Gamma shows how fast delta will change. Theta quantifies daily time decay. Vega measures sensitivity to IV moves. Long options traders fight theta and want vega on their side; sellers want the opposite.
- Data-quality checks: Watch for stale last-price quotes on thinly traded strikes, zero open interest (a strike nobody holds), and IV that jumps erratically between adjacent strikes, which usually means the data feed is lagging, not that the market genuinely repriced.
Pro Tip: Check open interest before you check price. A strike with heavy OI and a tight spread tells you more about where real money sits than a strike with a flashy percentage move and thin volume.
For a deeper walkthrough of delta, gamma, theta, and vega in live trading contexts, this topic is often covered in detailed guides such as the guide to reading options Greeks.
How Do You Turn Chain Data Into a Ranked Trade Idea?
A chain full of numbers becomes useful only once you run it through a sequence. Here's the checklist that turns raw data into a short list of candidate contracts:
- Pick your timeframe. Decide days-to-expiration (DTE) buckets first. Zero-to-seven DTE behaves nothing like 30 to 45 DTE.
- Mark the heavy OI strikes. These often act as informal support or resistance, especially near expiration.
- Compare OI change against price movement. This is where the four classic scenarios come in.
- Check IV and skew. Rising IV ahead of no obvious catalyst can mean something is brewing, or it can mean a market maker is repricing risk after a large block trade.
- Confirm liquidity and spread width before you get attached to a strike.
- Estimate probability of profit (POP) and expected move using delta as a rough proxy.
- Size the position and set an entry only after the first five steps check out.
The four OI-and-price scenarios traders lean on constantly: price rising with OI increasing signals fresh long buildup; price rising with OI decreasing signals short covering, not new conviction; price falling with OI increasing signals fresh short buildup; price falling with OI decreasing signals long unwinding as holders exit. None of these four patterns comes from a formal academic model, but the pattern shows up so consistently across trading education that it's become a default heuristic for reading positioning shifts.
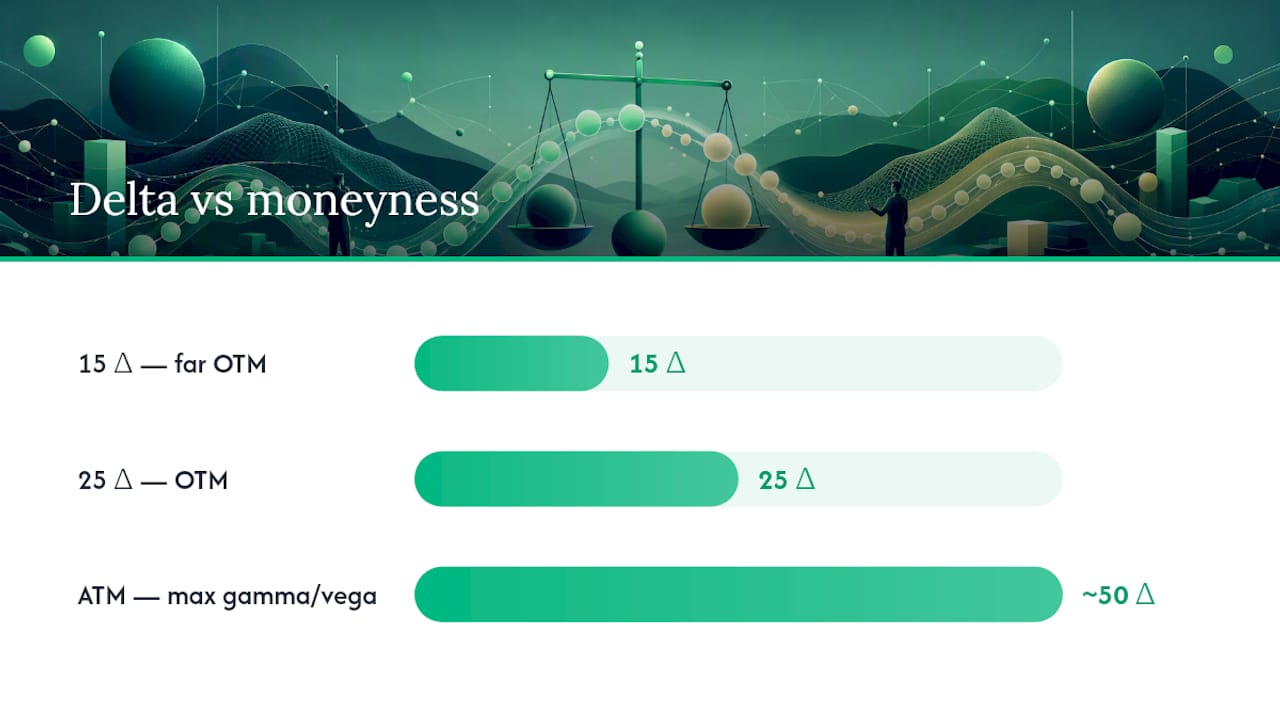
On strike selection, most active traders use shorthand: a "15 delta" or "25 delta" strike refers to options with roughly that delta value, a fast way to gauge how far out-of-the-money and how statistically probable a touch or expiry-ITM outcome is. For straddles and strangles, at-the-money (ATM) strikes maximize gamma and vega exposure, which is exactly the point when you're betting on volatility rather than direction.
What Do Implied Probabilities From an Options Chain Really Mean?
Every option price on the chain is a puzzle piece. Put them all together across strikes and you get an implied probability distribution, the market's collective bet on where the underlying will land by expiration. Extracting that distribution cleanly from raw quotes requires smoothing, because a chain built from discrete, sometimes noisy prices doesn't hand you a clean curve. The Breeden–Litzenberger relationship shows that the second derivative of call prices with respect to strike maps to that risk-neutral density, but practitioners fit a full IV surface first rather than taking a raw finite difference, since that raw approach amplifies noise.
Practical shortcuts help without requiring you to run the math yourself:
- Delta on a short-dated, near-the-money option approximates its risk-neutral probability of finishing in the money.
- Probability of touching a strike before expiration runs roughly double the probability of finishing there at expiration for many out-of-the-money strikes, under standard Brownian approximations.
- Use POP as a sizing input, not a certainty. A 70% POP trade still loses three times in ten.
Risk-neutral distributions are not real-world forecasts. They routinely overprice tail risk, and those tails widen further around earnings and Fed announcements, which is exactly when reading them pays off most.
Different IV surface models (SVI, eSSVI, SABR) can produce meaningfully different tail estimates from the same raw chain, so lean on a platform's built-in probability tool rather than eyeballing a single strike's delta and calling it done.
Which Tools Actually Speed Up Chain Analysis?
Five tool categories cover almost everything an active trader needs: a live chain viewer with fast expiration switching, an IV surface or probability extractor, a P&L and Greeks calculator, a multi-leg strategy builder, and a flow scanner that flags unusual size relative to open interest.
A compact pre-market routine looks like this:
- Scan for OI concentration and unusual OI shifts overnight
- Flag strikes with an IV spike relative to their 30-day average
- Pull POP and expected move for your top two or three candidates
- Check bid/ask spread width on each candidate
- Size the position against account risk before the bell
Most basic chain viewers and volume/OI data are free through your broker. Deeper features, IV surface fitting, multi-leg payoff modeling, and historical flow comparisons, typically sit behind a subscription or institutional terminal. A calculator like the one from ApexVol handles P&L, breakeven, and Greeks across single and multi-leg positions without needing a Bloomberg terminal.
How Morningoptions Runs This Checklist Every Morning
Every step above maps to automated data processing workflows that scan for concentrated open interest and IV spikes before market open. Ranked contract ideas ideally come with entry levels attached, not just a ticker and a hunch. Some services offer free daily briefings with a limited set of ideas and paid tiers that add scanners for midday setups and AI chat scanners for researching specific tickers on demand. For a look at how ideas get ranked in the first place, see how options scoring models work.
What I've Learned Watching Chains Every Morning
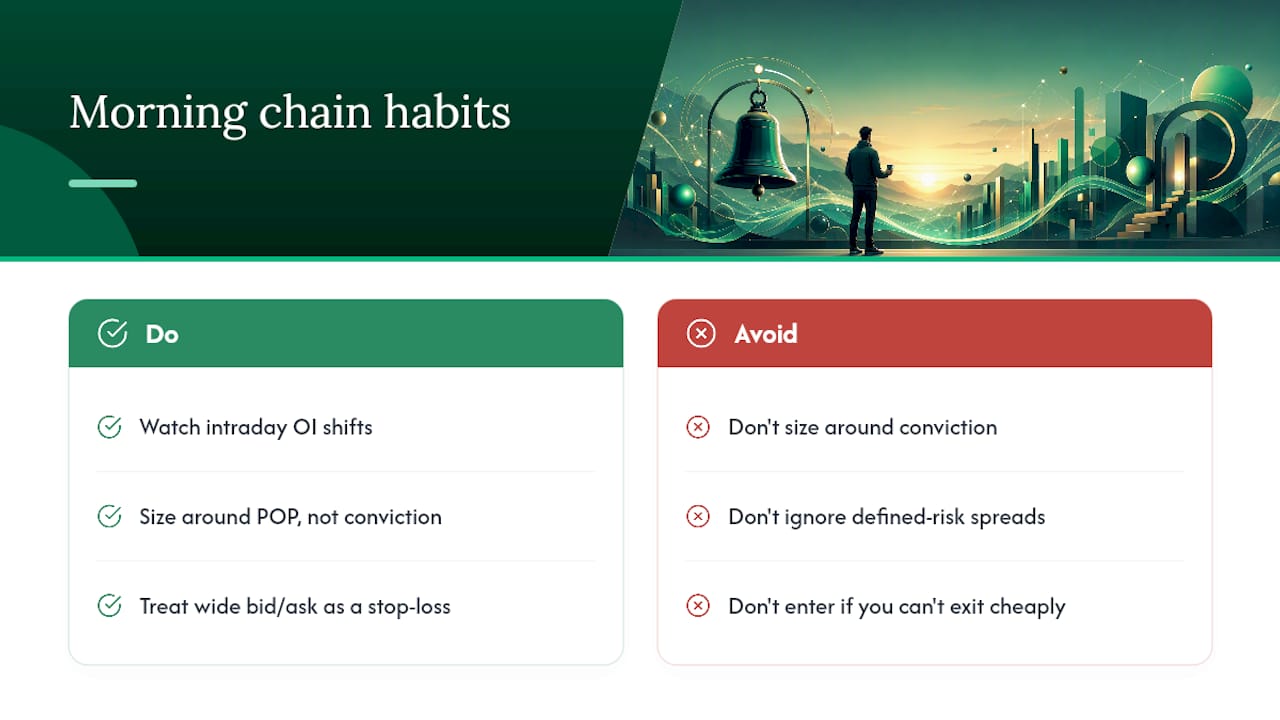
Three habits separate traders who use chain data well from those who just stare at it. First, watch intraday OI shifts, not just the prior day's close. A strike that builds OI fast during the session often front-runs the next headline. Second, size around POP, never around conviction. Third, treat a wide bid/ask spread as a stop-loss condition on its own. If you can't exit cheaply, you shouldn't have entered.
None of this replaces defined-risk structures. Spreads cap your downside in ways naked options don't, and that matters more than any signal on the chain.
— Customer
Get Ranked Trade Ideas Before the Bell
Running this entire checklist by hand, every morning, before the market opens, is exactly the kind of work some services aim to shortcut. Instead of scanning strikes for OI concentration and IV spikes yourself, users may get daily briefings with that scan already done, ranked contract ideas with entry levels attached, and downside risk considerations laid out to aid decision making.

Some platforms offer a free tier delivering daily briefings with a limited set of ideas, and paid tiers that unlock a lunchtime scanner for midday setups and an AI chat scanner for on-demand ticker research. If your current routine is checking a chain cold every morning, start with a free daily briefing to see how much of that checklist it can help with before you open a trade.
Sources
For probability extraction mechanics, see the Options Analysis Suite documentation. For volatility forecasting research, review the Springer study on ML-based option prediction. On flow interpretation, read Morningoptions' options flow analysis guide, and for traders scaling into funded accounts, TopPropOffers compares prop trading challenge structures.
- Probability Analysis - Price Distributions | Options Analysis Suite
- Options Profit Calculator — Free P&L, Greeks & Breakeven | ApexVol